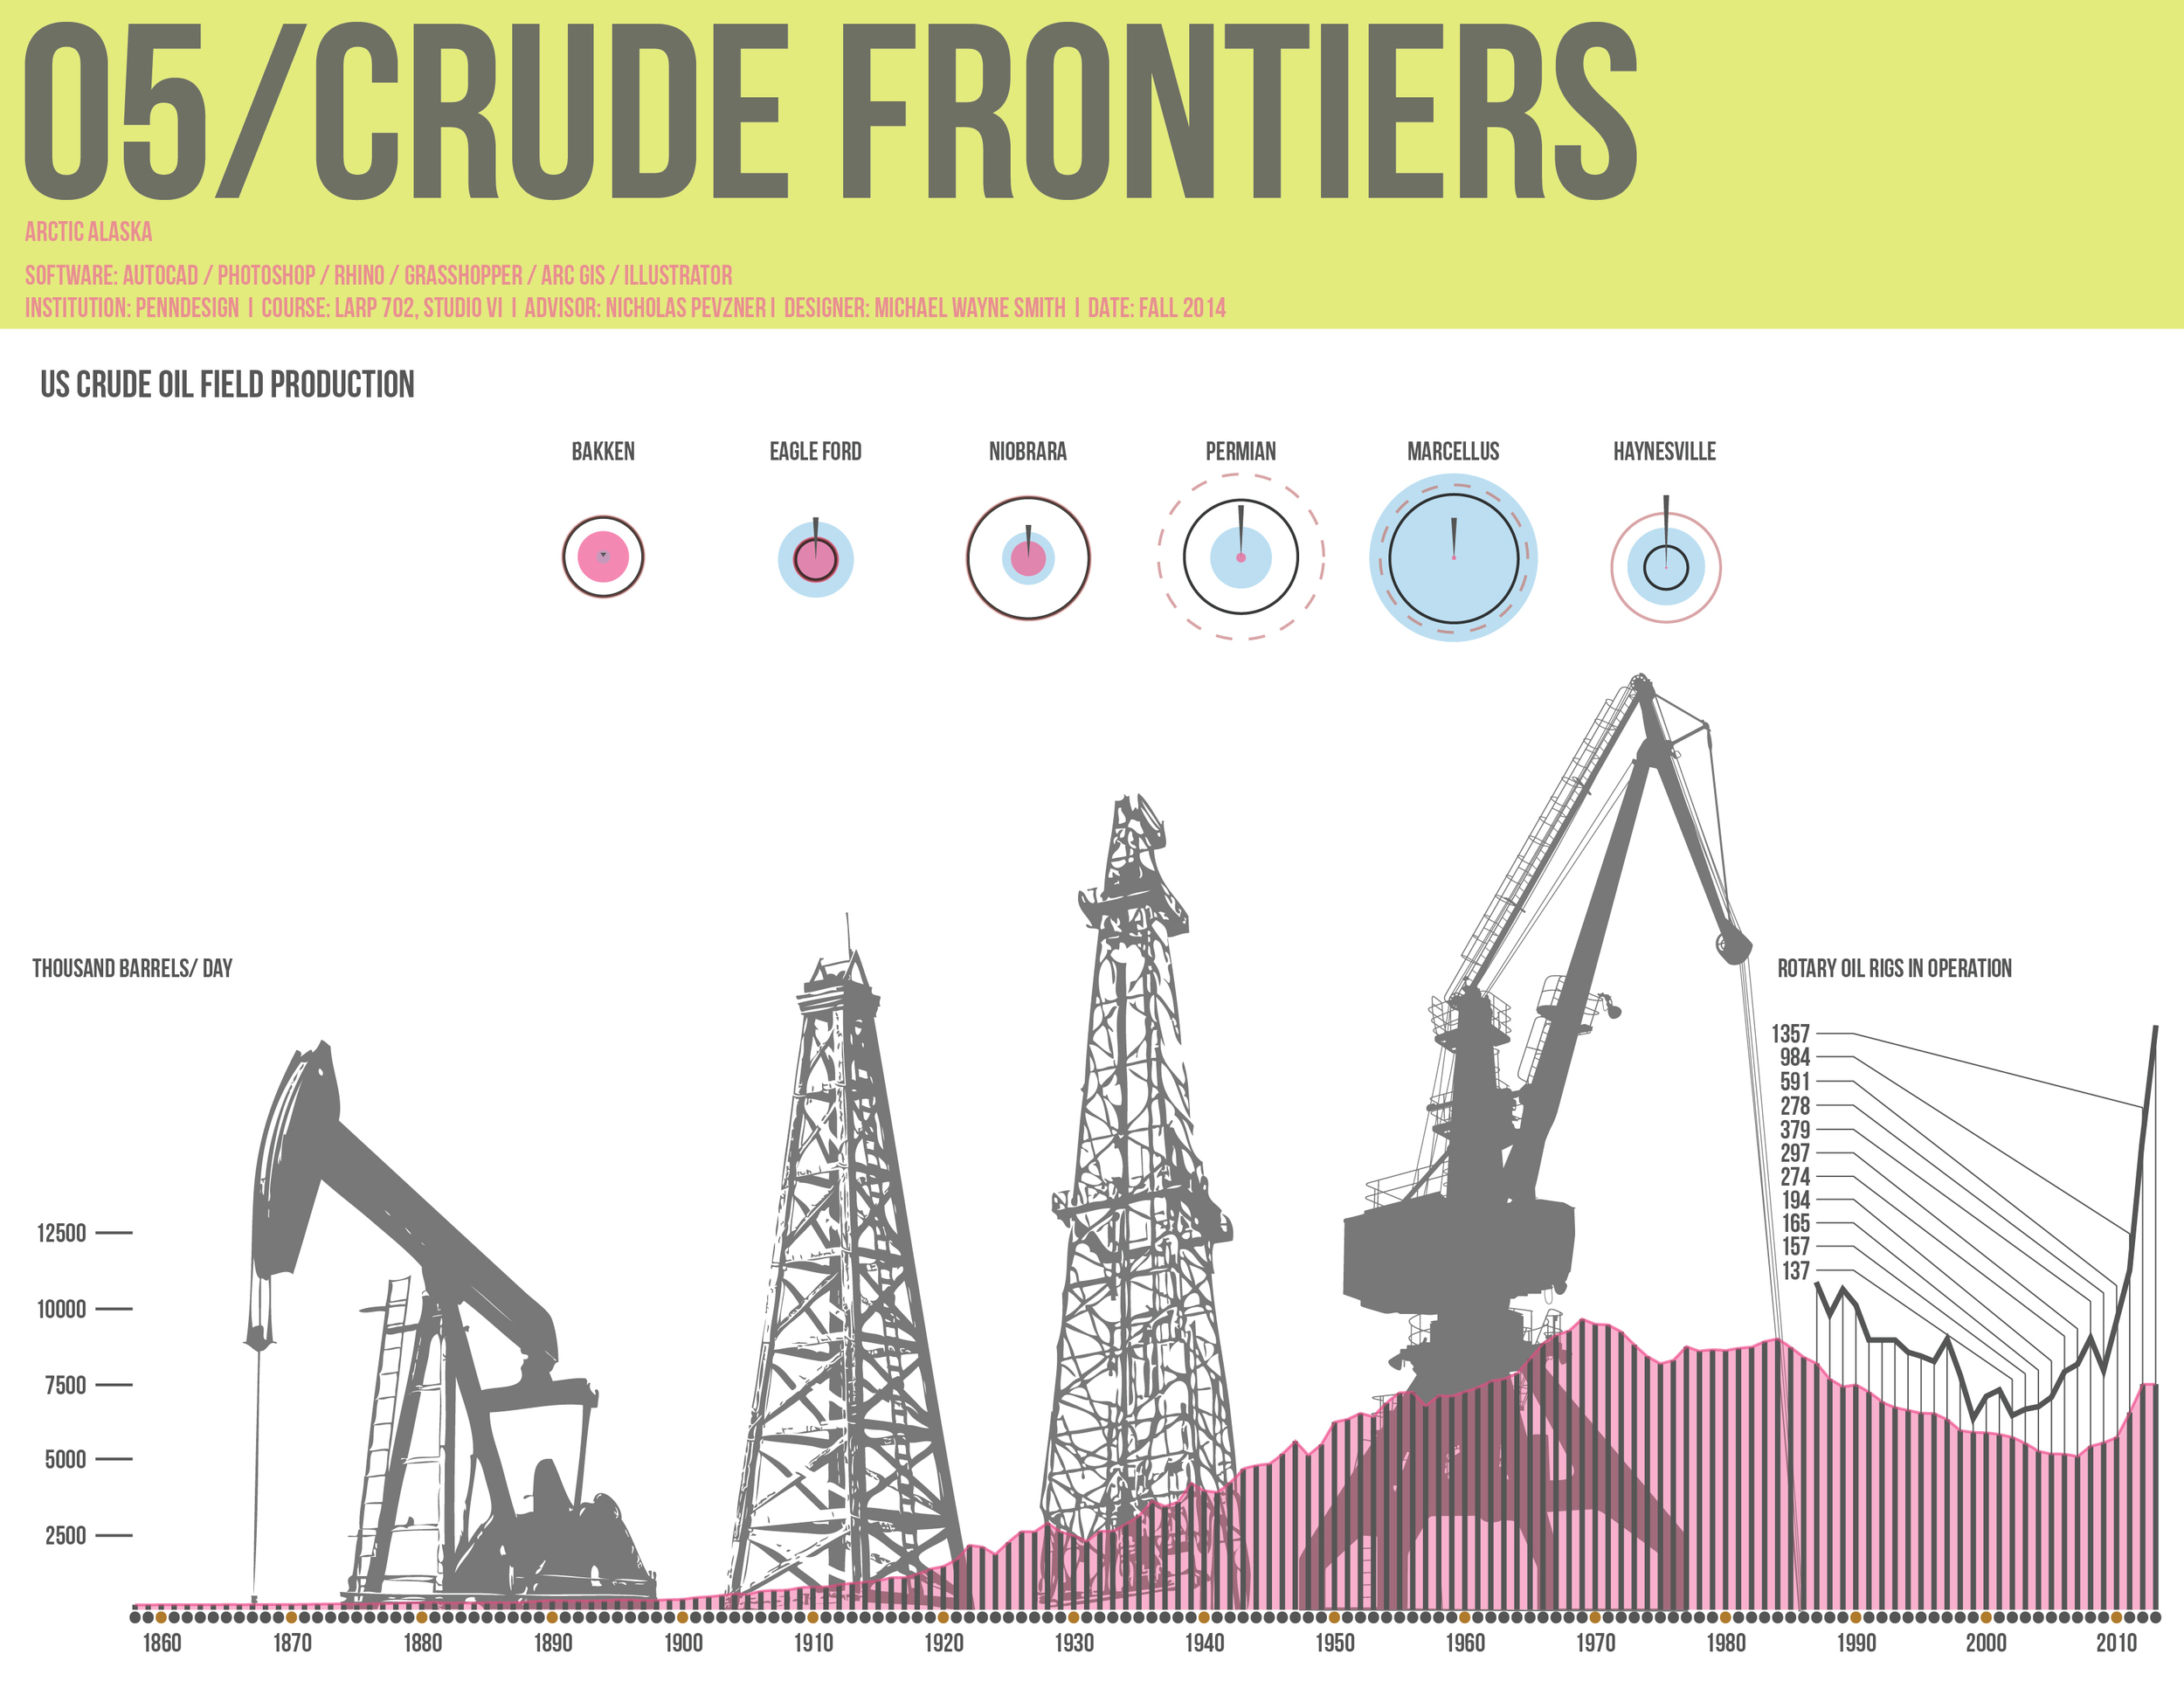
U.S. Crude Oil Field Production
The oil production from United States shale’s has been viewed as prolific since the early 1900’s. However, the reality is that the country’s crude oil resources have been in decline since 1970. To combat this recession, oil rigs have been exponentially deployed across the country’s oil fields. This strategy will likely show temporary supply increases but deplete the remaining resources at an accelerated rate.
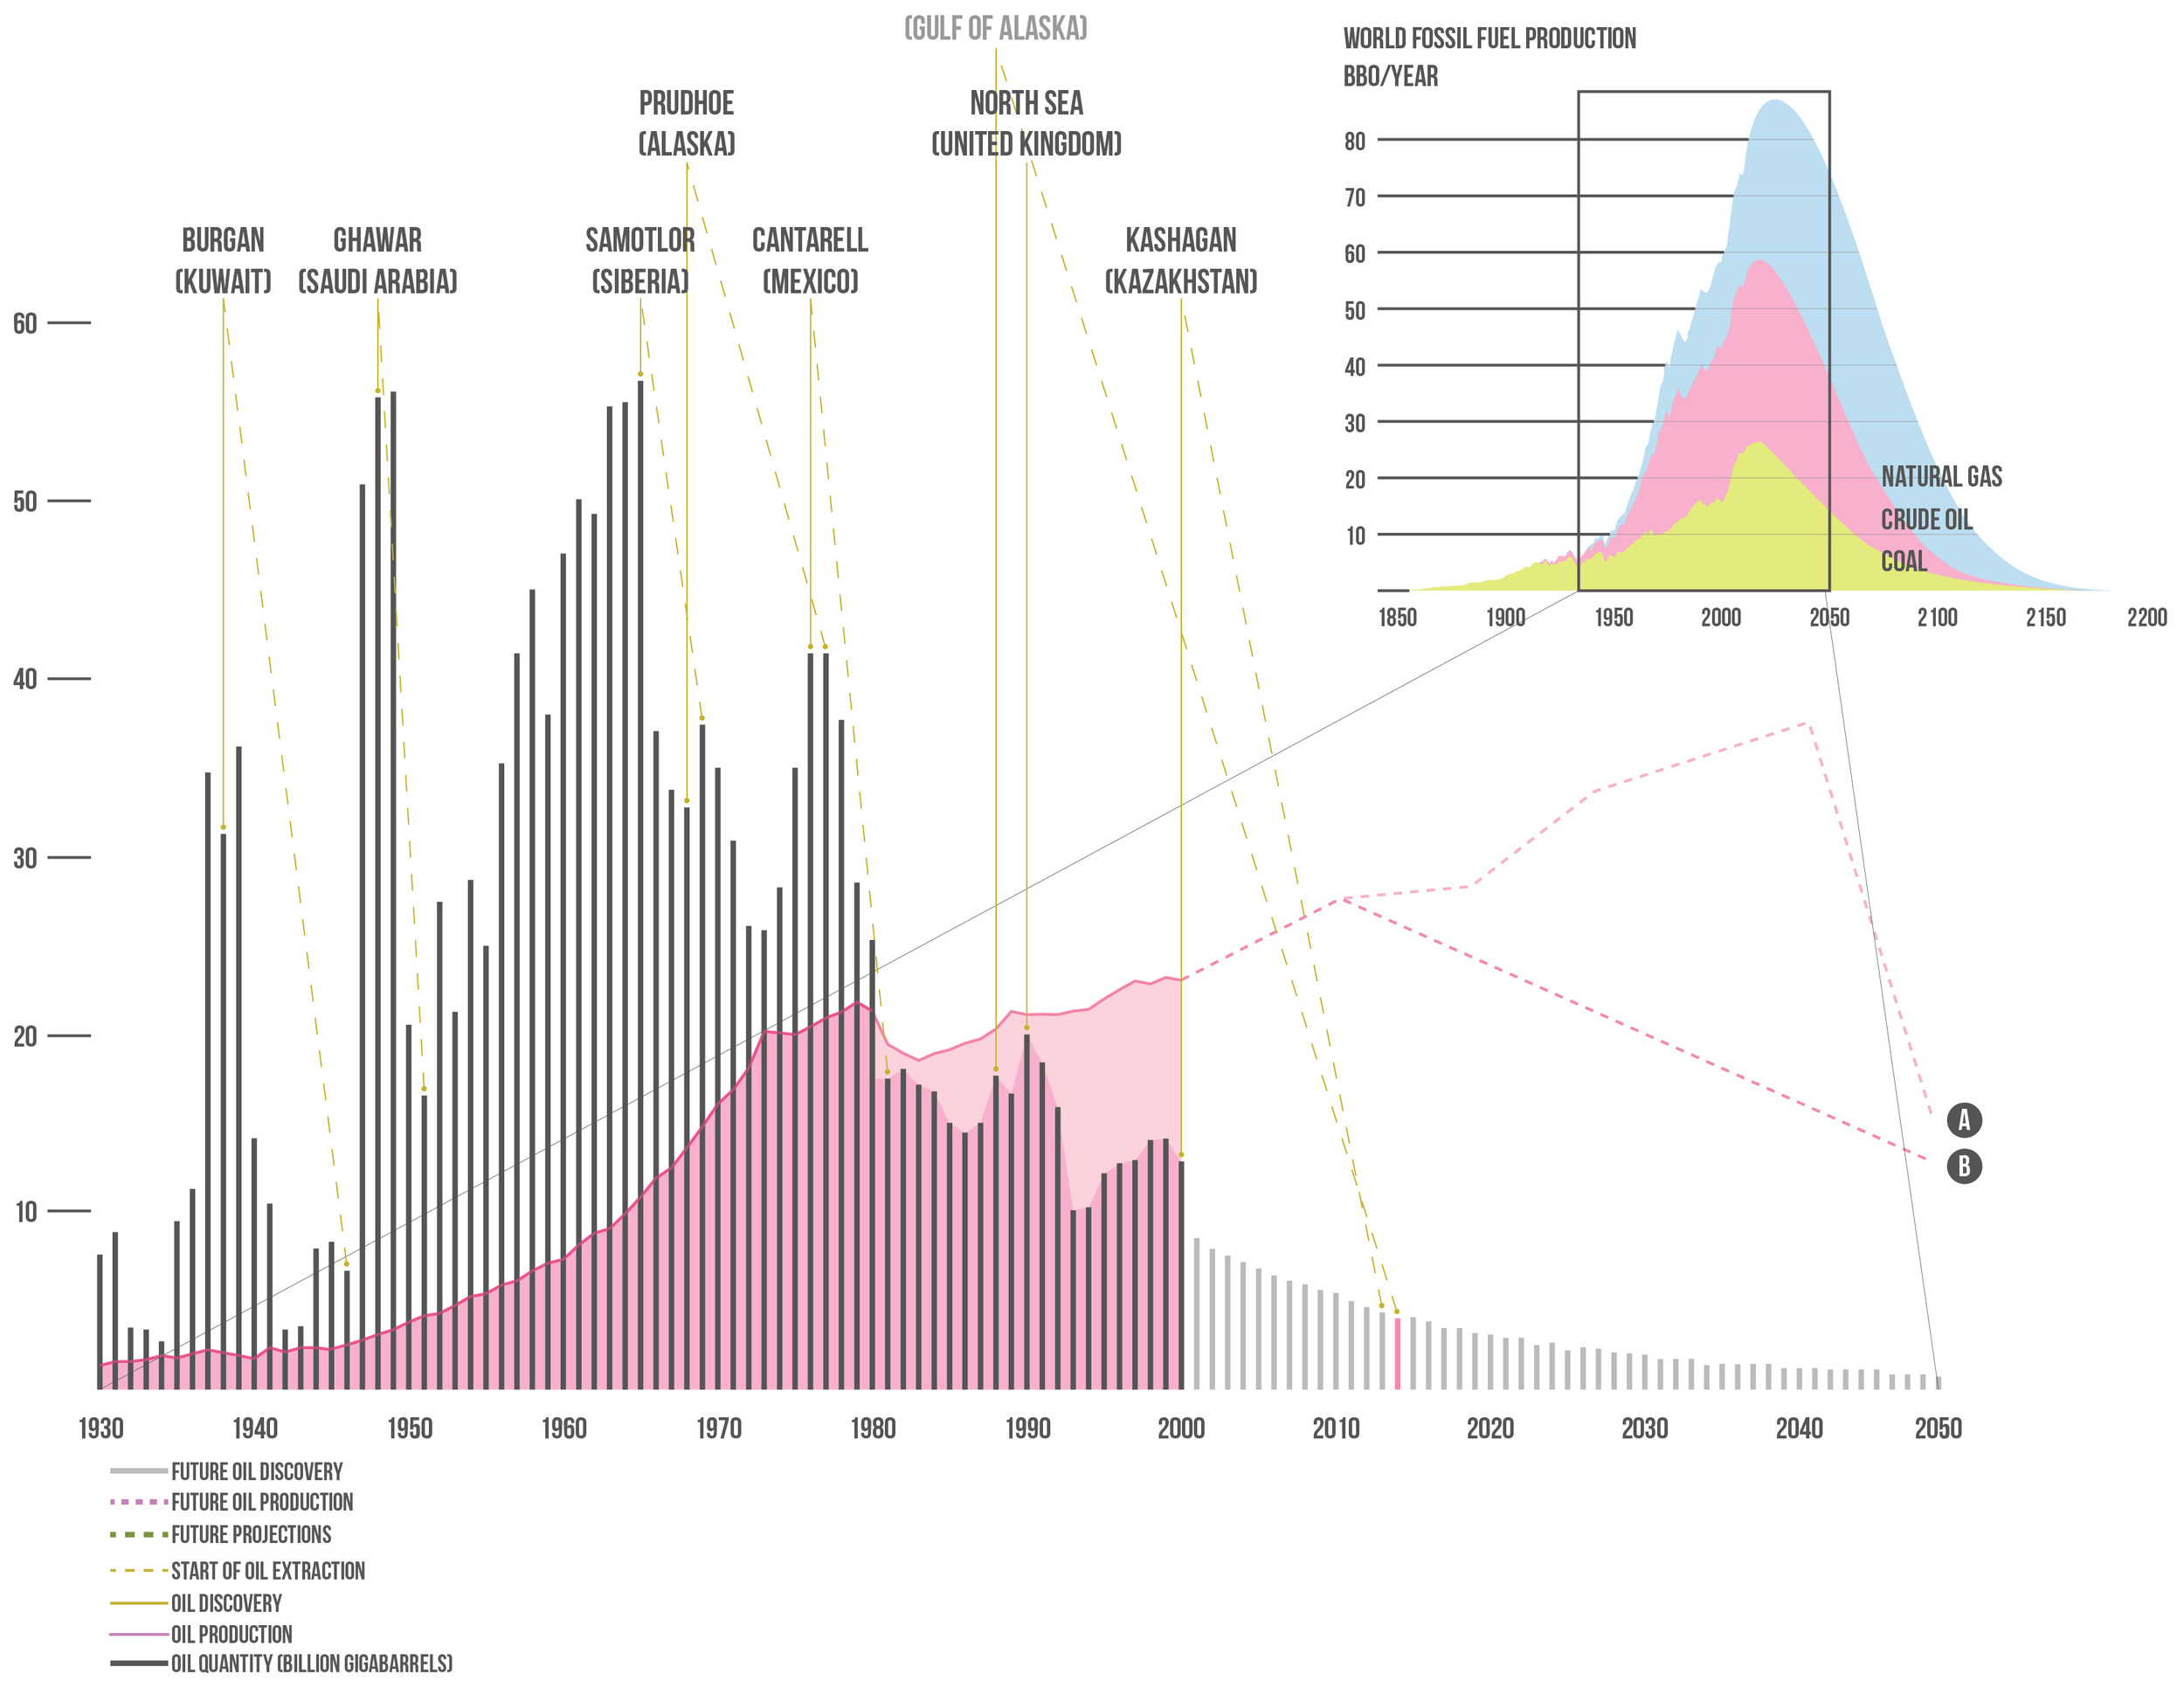
World Oil Discoveries
Globally the discovery and consumption of crude oil has experienced the same ascendance until the 1970’s; around this time the world experienced peak oil. Demands continued to rise while production volumes began to fall.
The future of oil production is expected to decrease while consumption is predicted to follow its current trajectory over the next 50 years. How will the world’s future energy void be filled?
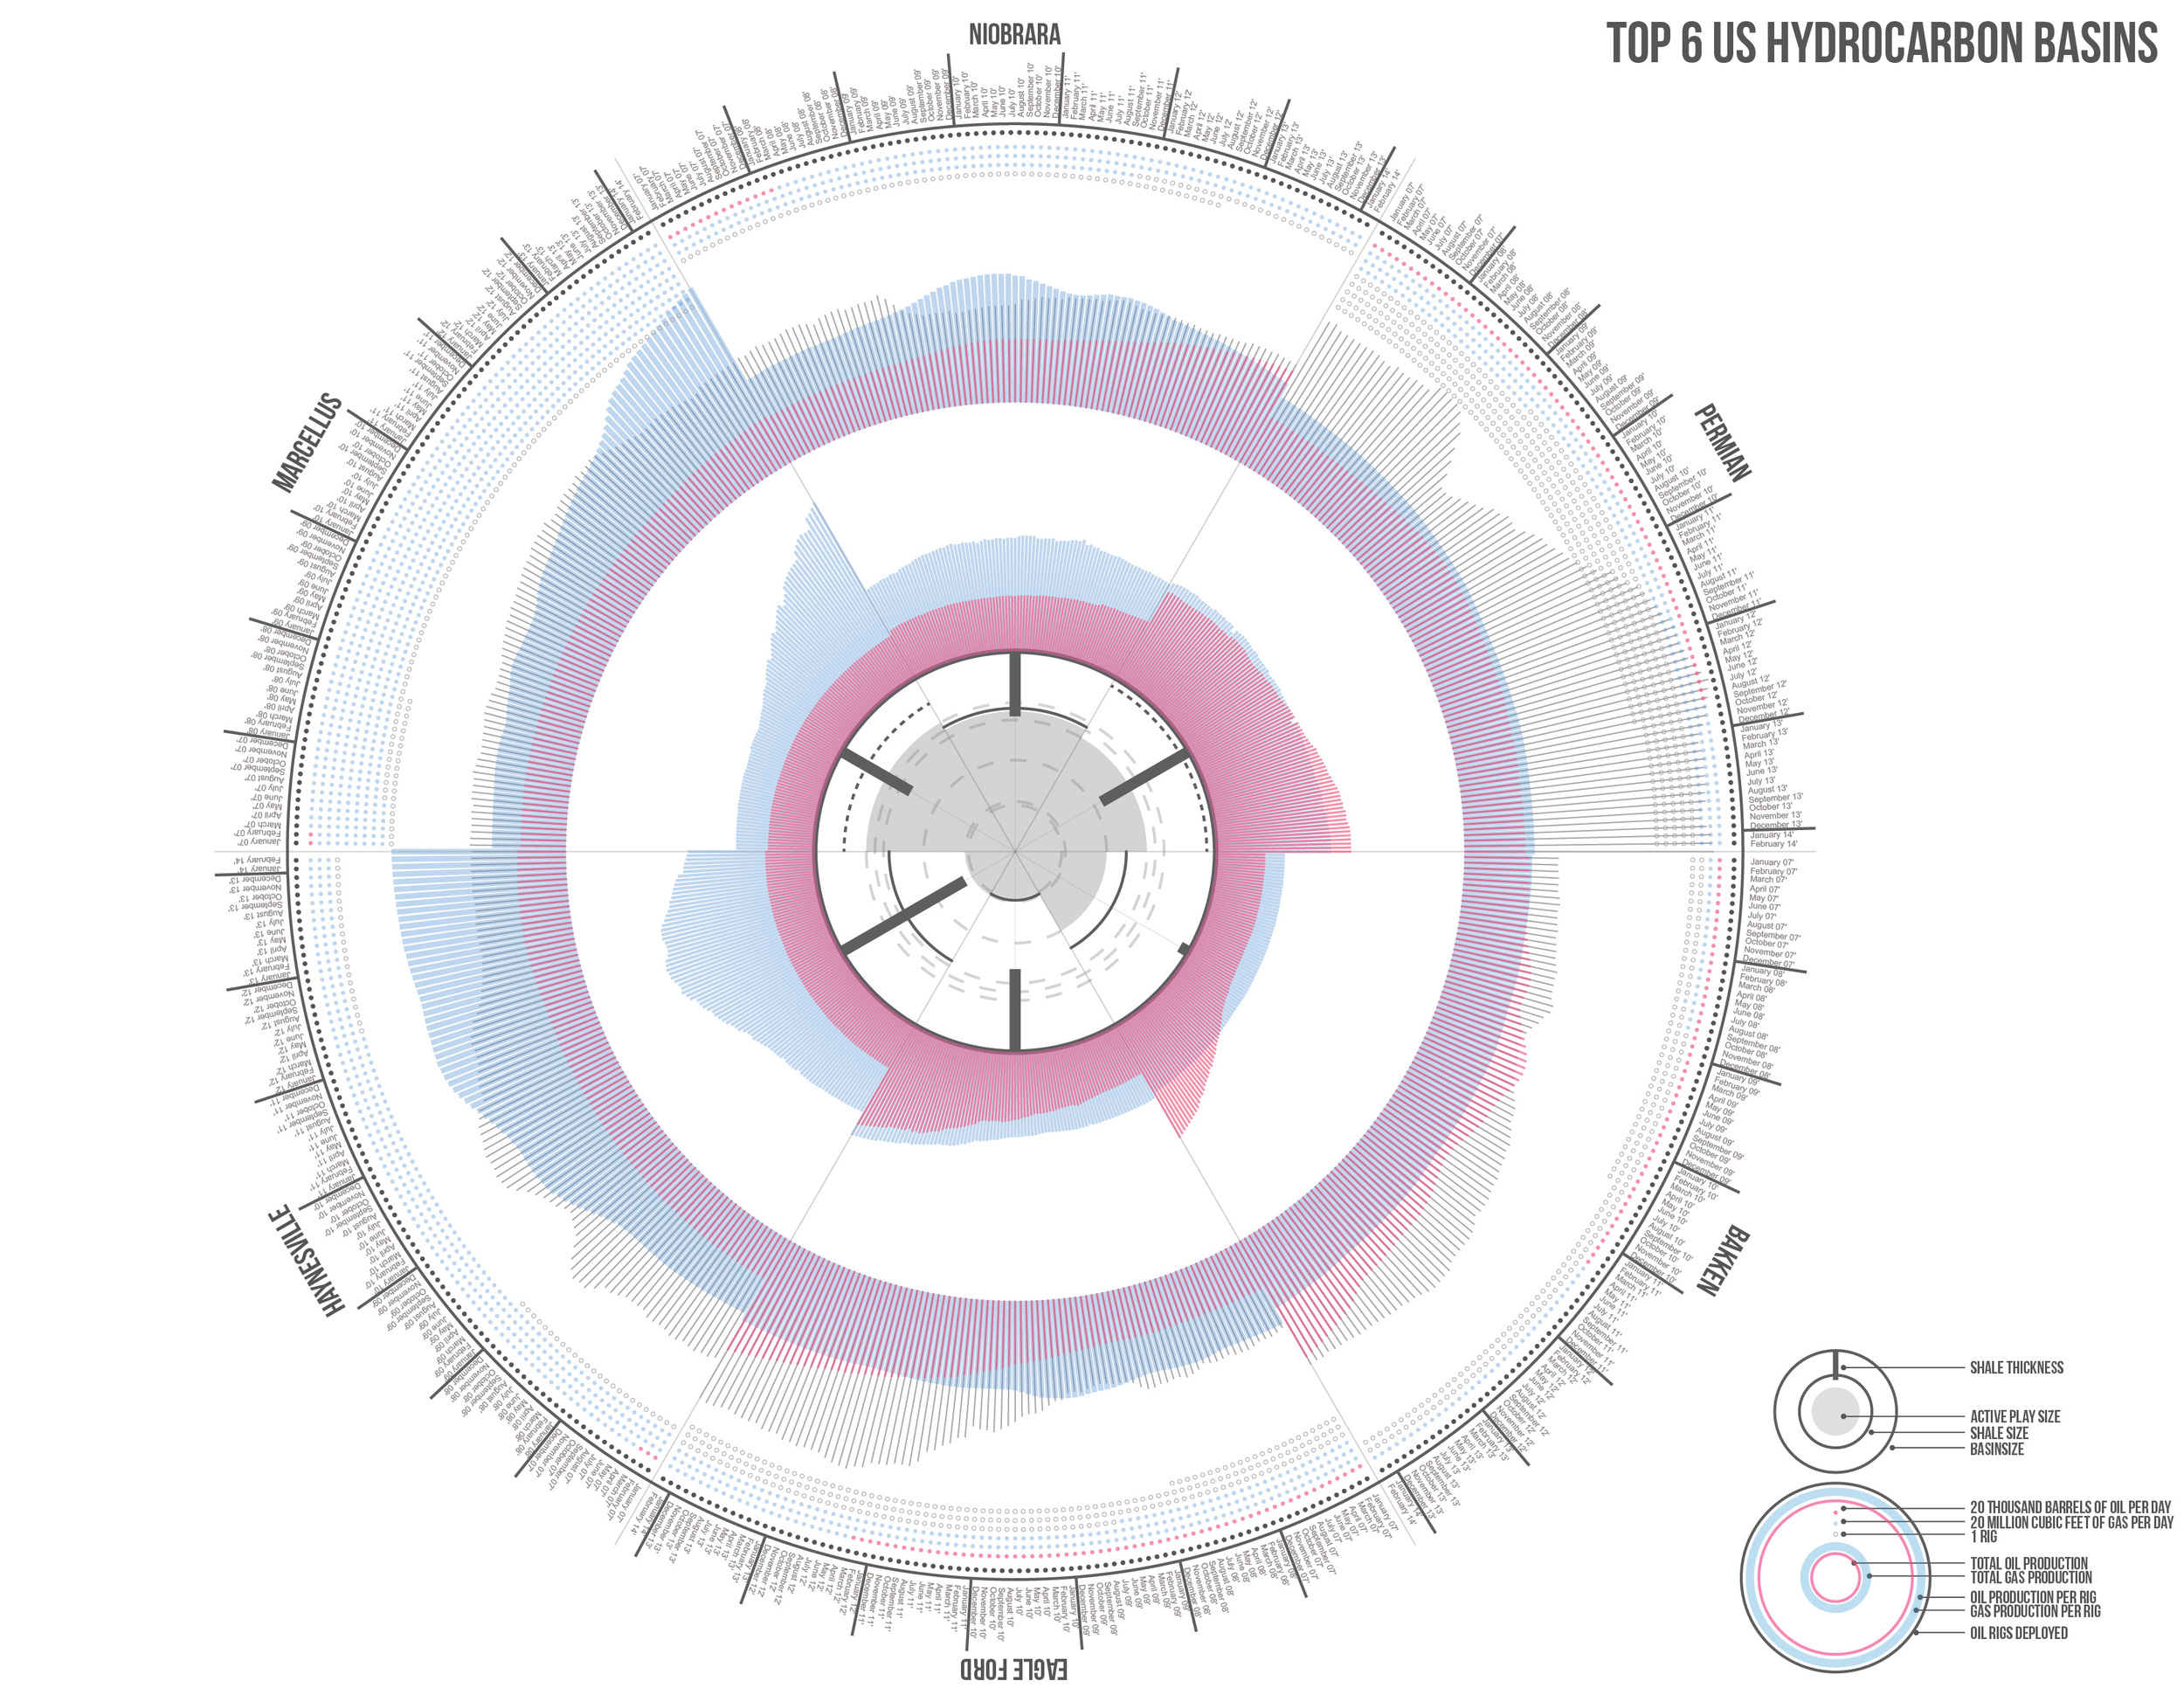
Top 6 U.S. Hydrocarbon Basins
The depletion of hydrocarbons can be seen when examining the recent years within the 6 highest producing U.S. hydrocarbon basins. This data set was extracted from January 2007 to February 2014. Over this seven year period oil production from the basins continued to slowly increase, however, this was only because of the immense number of oil rigs that increased within the basin every month.
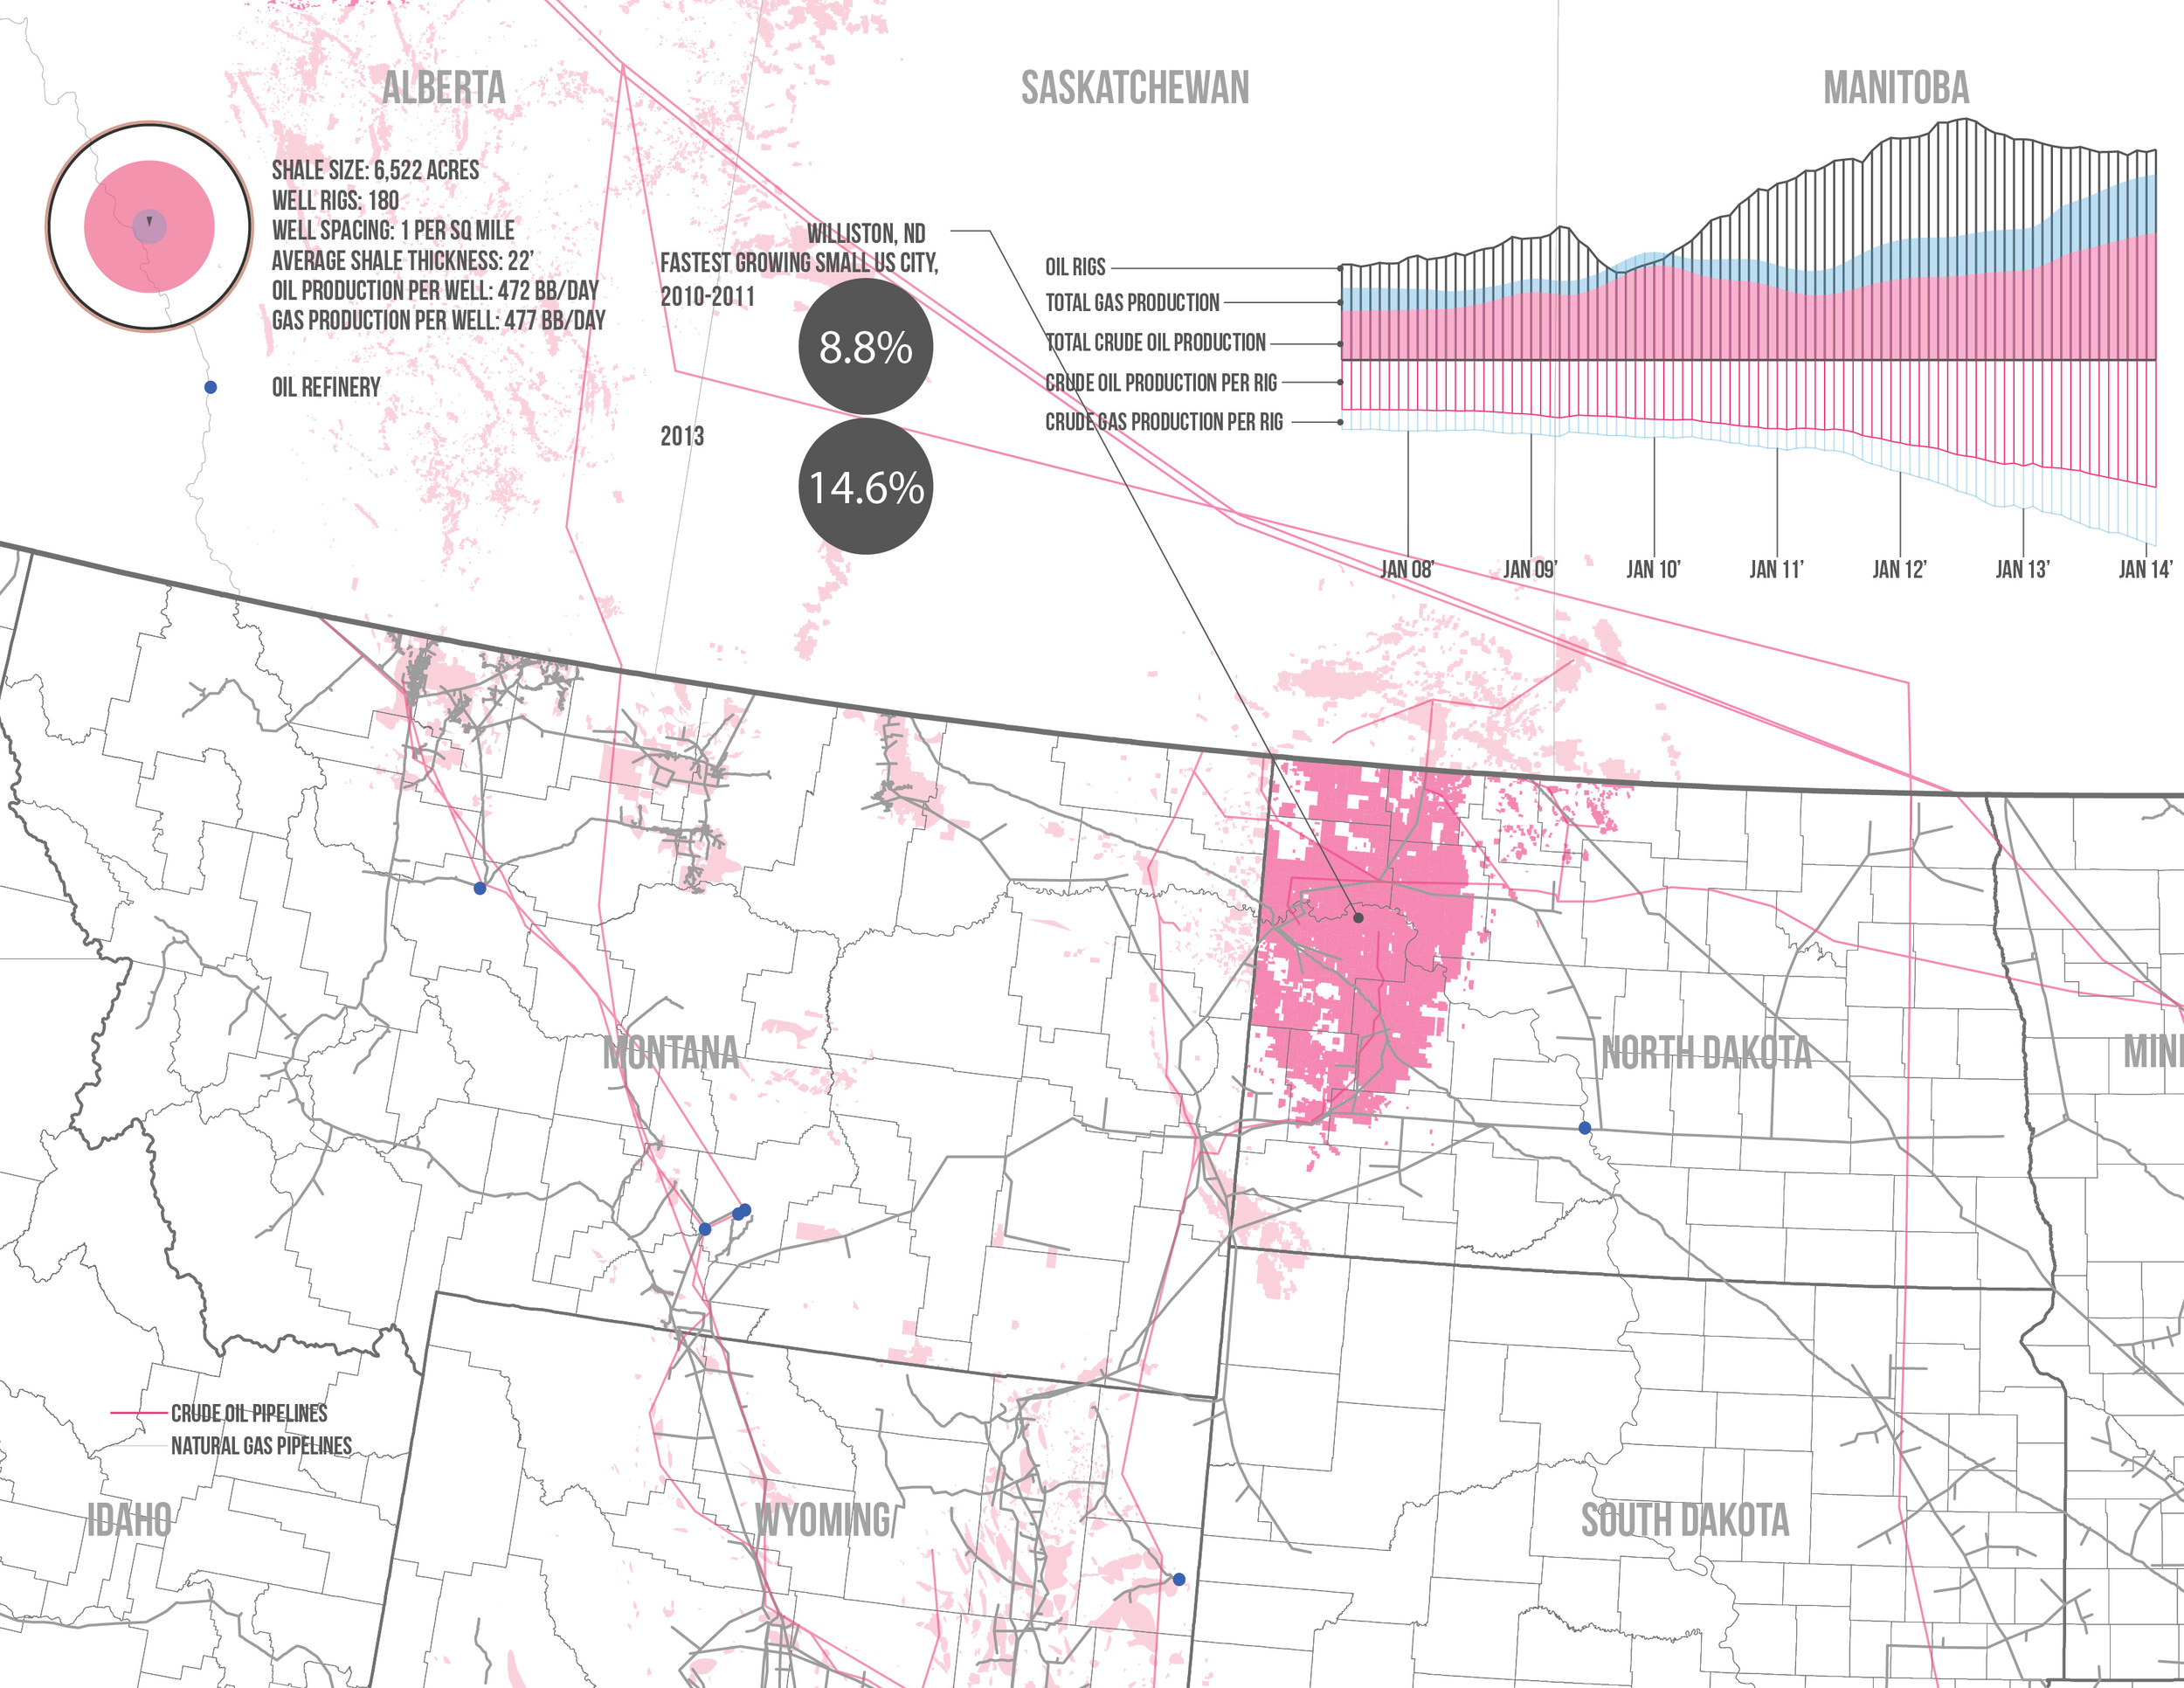
Bakken Formation
Arguably the largest measurable reserves, the Bakken formation illustrates the typical flaws in extraction operations in the United States. Here, the increasing number of oil rigs that are erected to support the diminishing oil resources are creating two common problems associated with this practice. The first is relying on a non-renewable resource to solve a long-term problem. Where will our energy come from when the oil wells run dry?
The second problem is the consequential boomtowns that establish for the support of a semi-permanent infrastructure. When production declines, where will the workers go and what will become of the structures left behind?
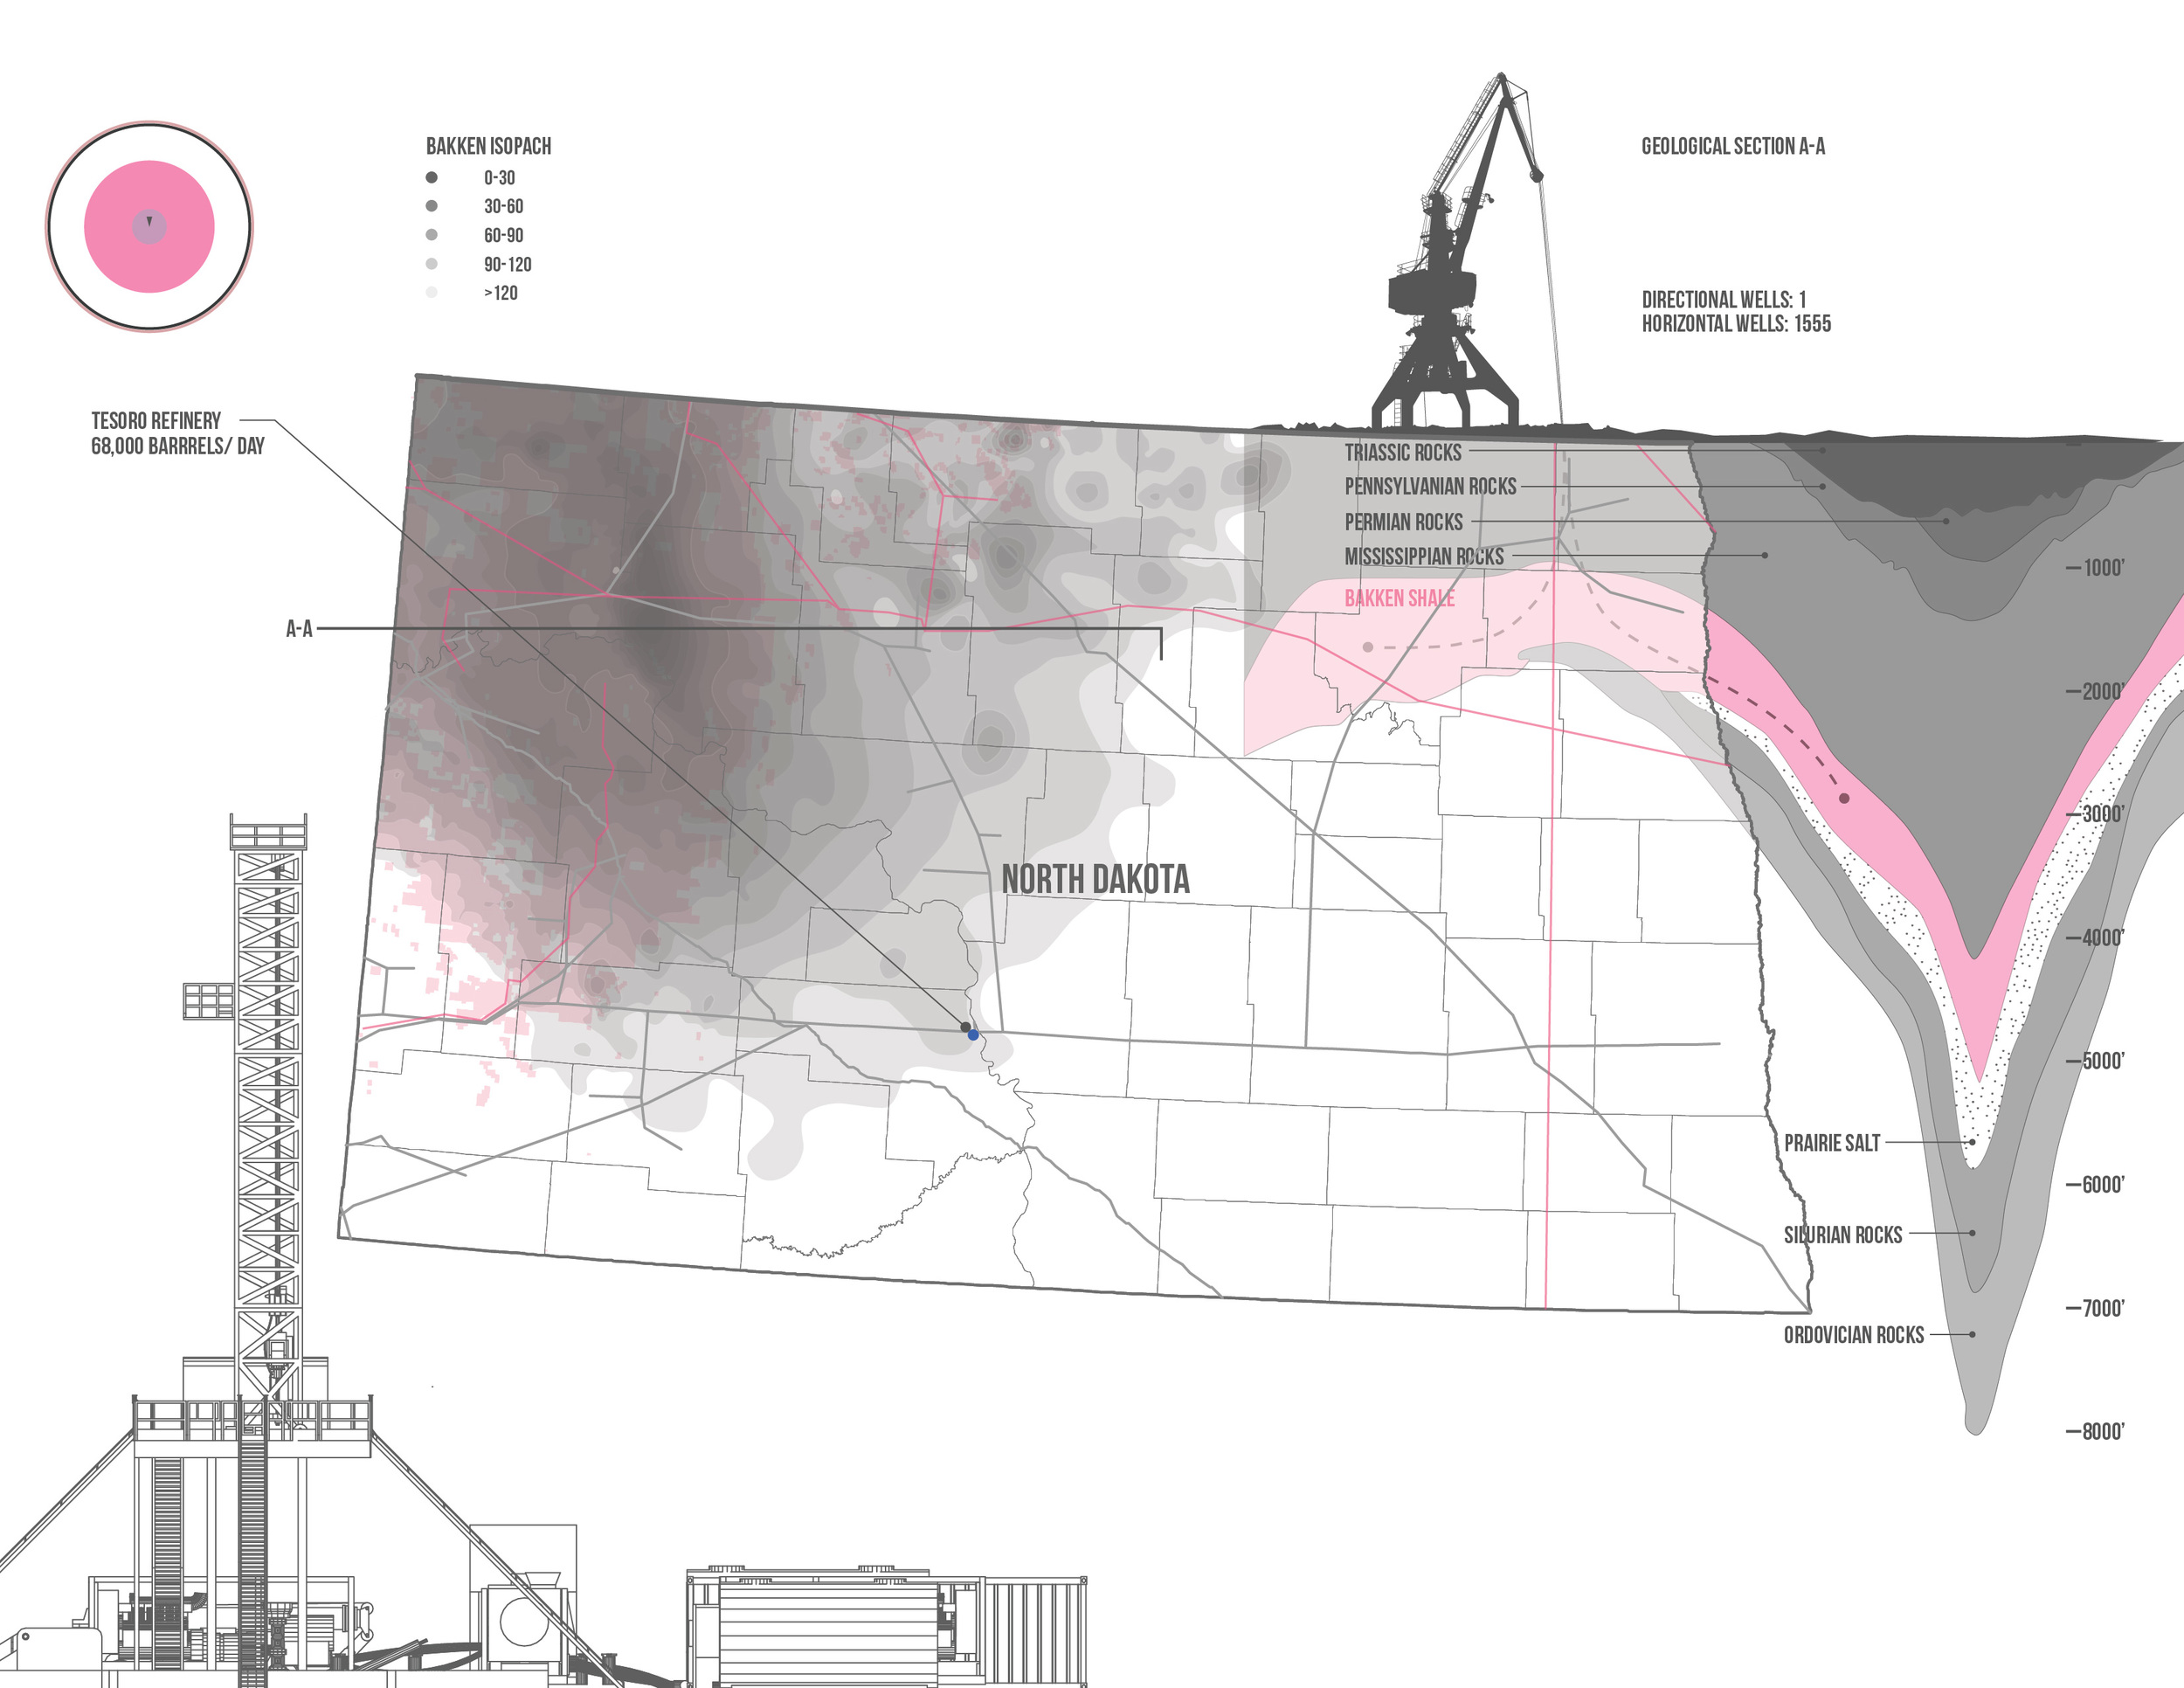
North Dakota Oil Rigs
In addition to deploying more oil rigs across the hydrocarbon landscapes, new drilling technologies are contributing to the accelerated draining of energy resources.
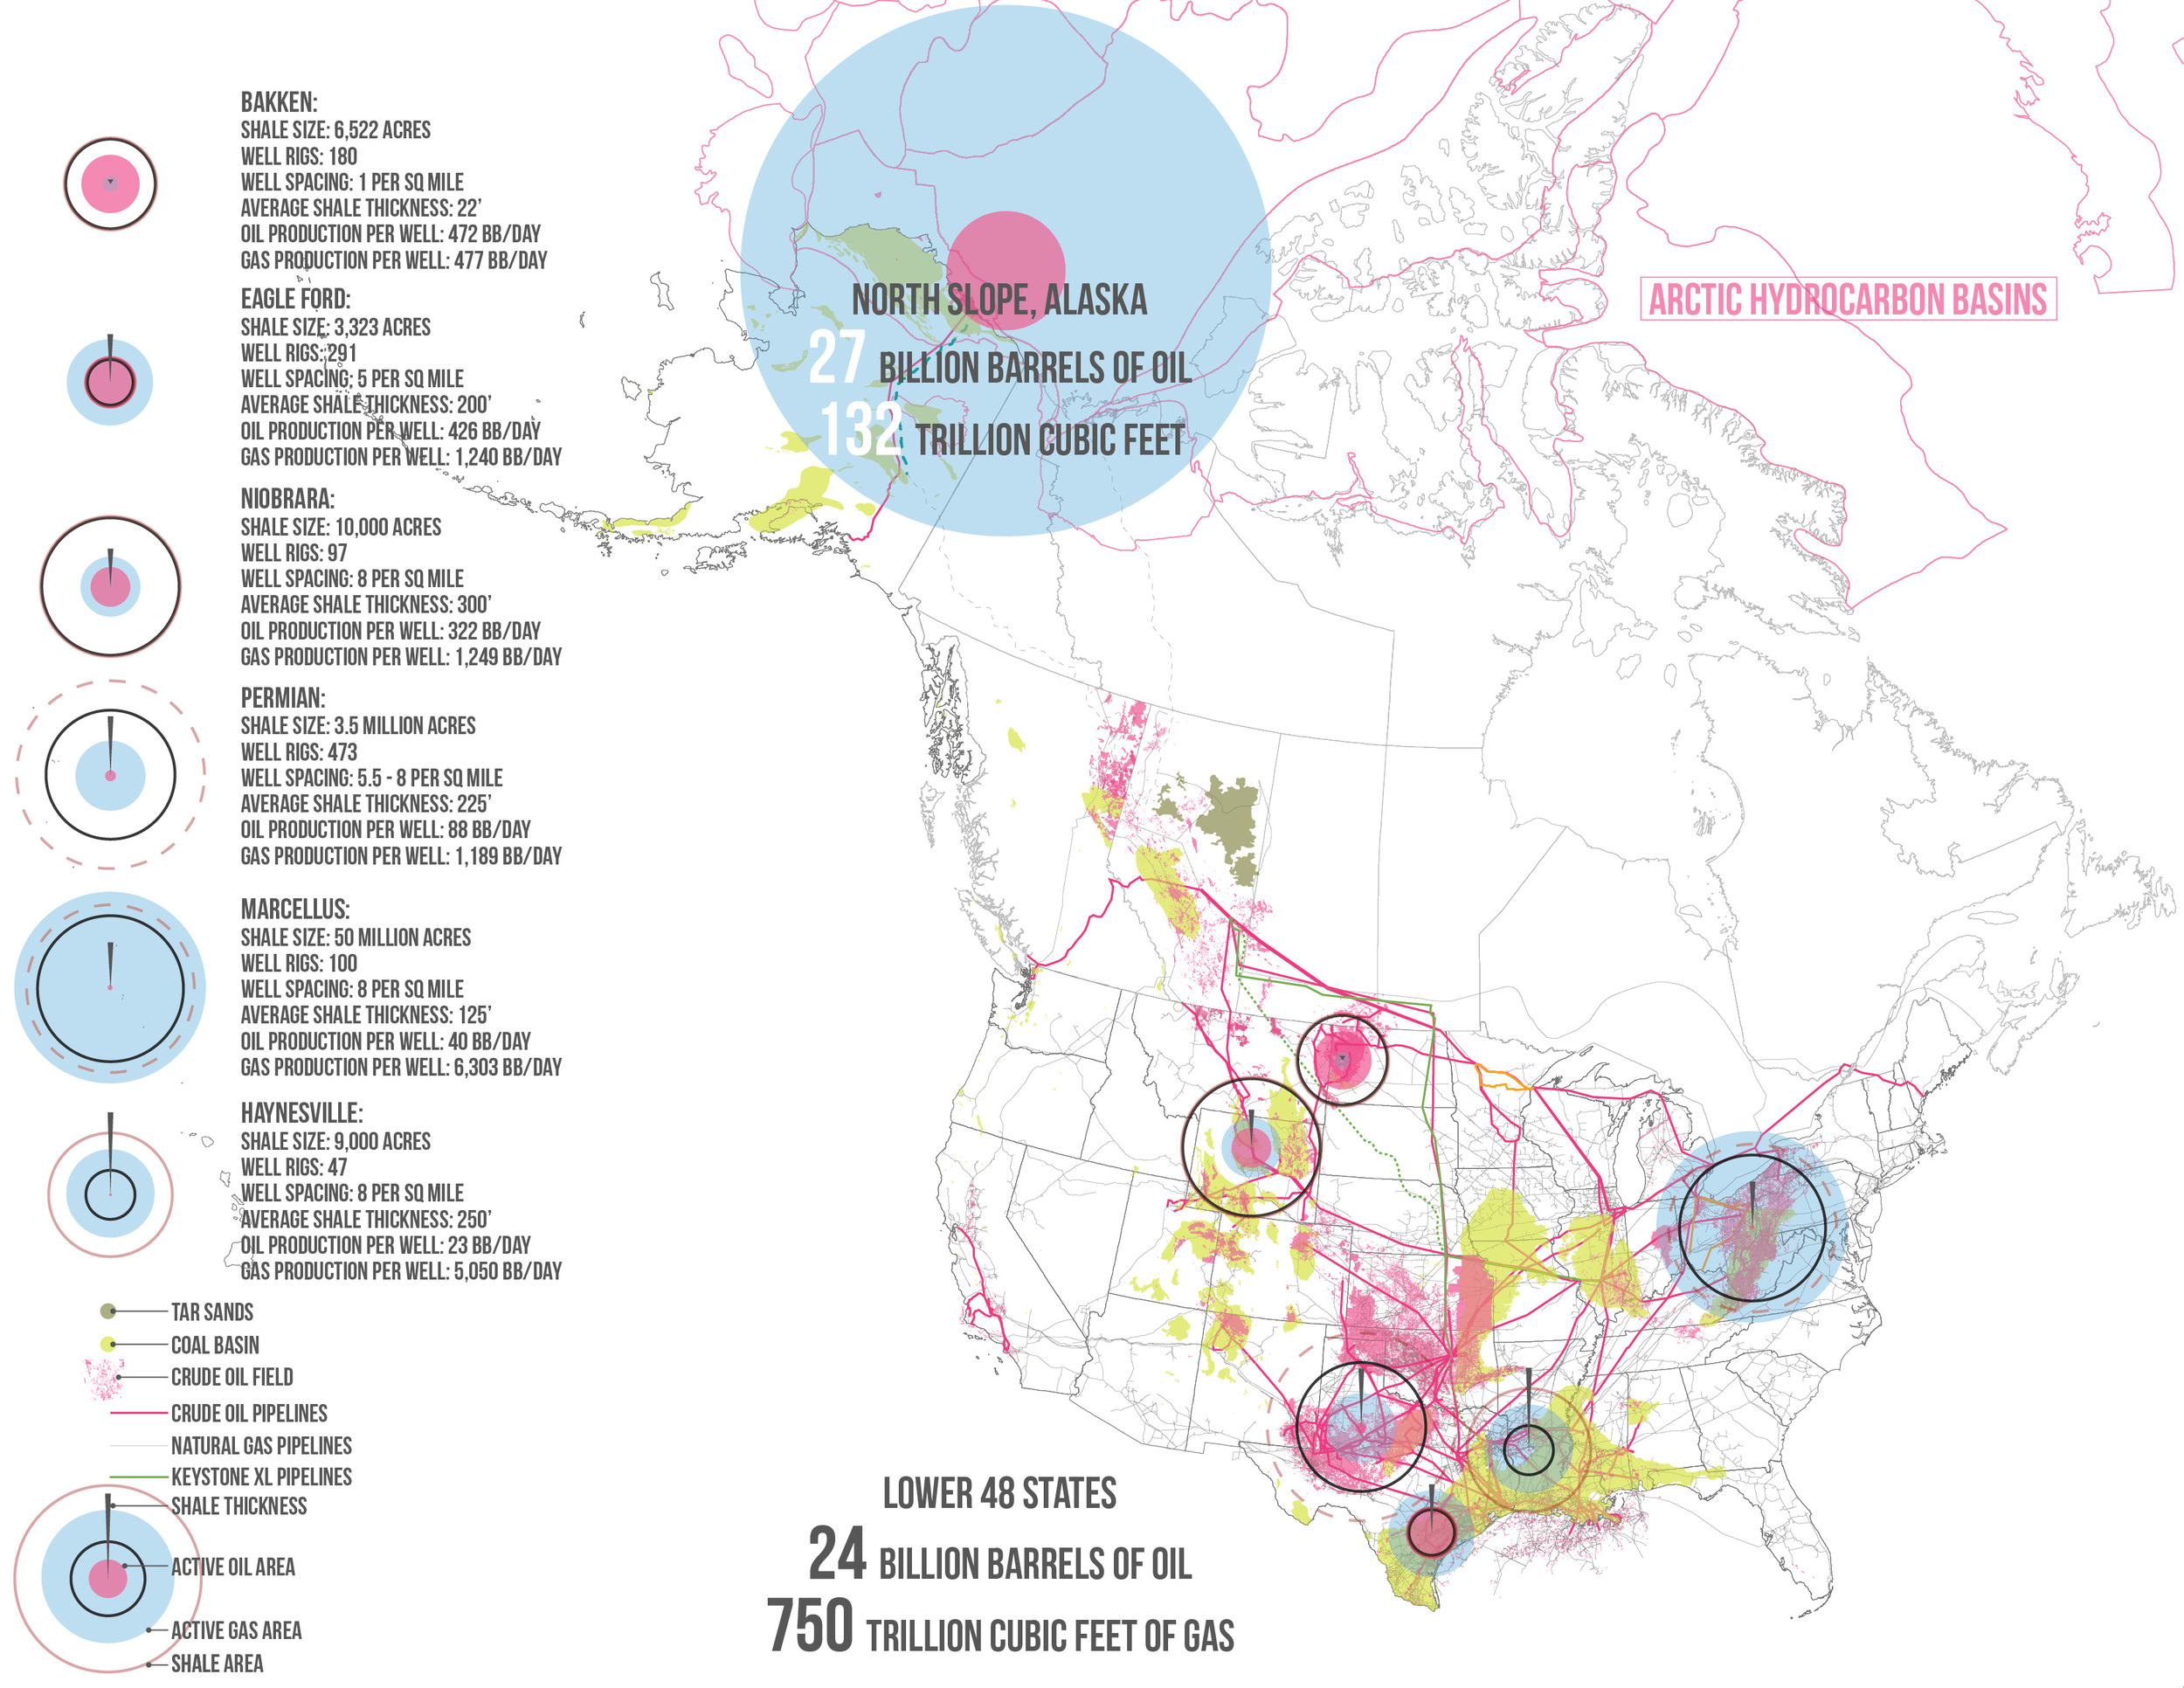
North American Fossil Fuel Atlas
In North America the fossil fuel resources ranks among the most productive in the world. With the estimated remaining resources in the contiguous lower 48 states declining we must look elsewhere for future energy resources.
Off the coast of Alaska a concentrated untapped volume of hydrocarbons was recently discovered that rival the total remaining resources in the lower 48 states.
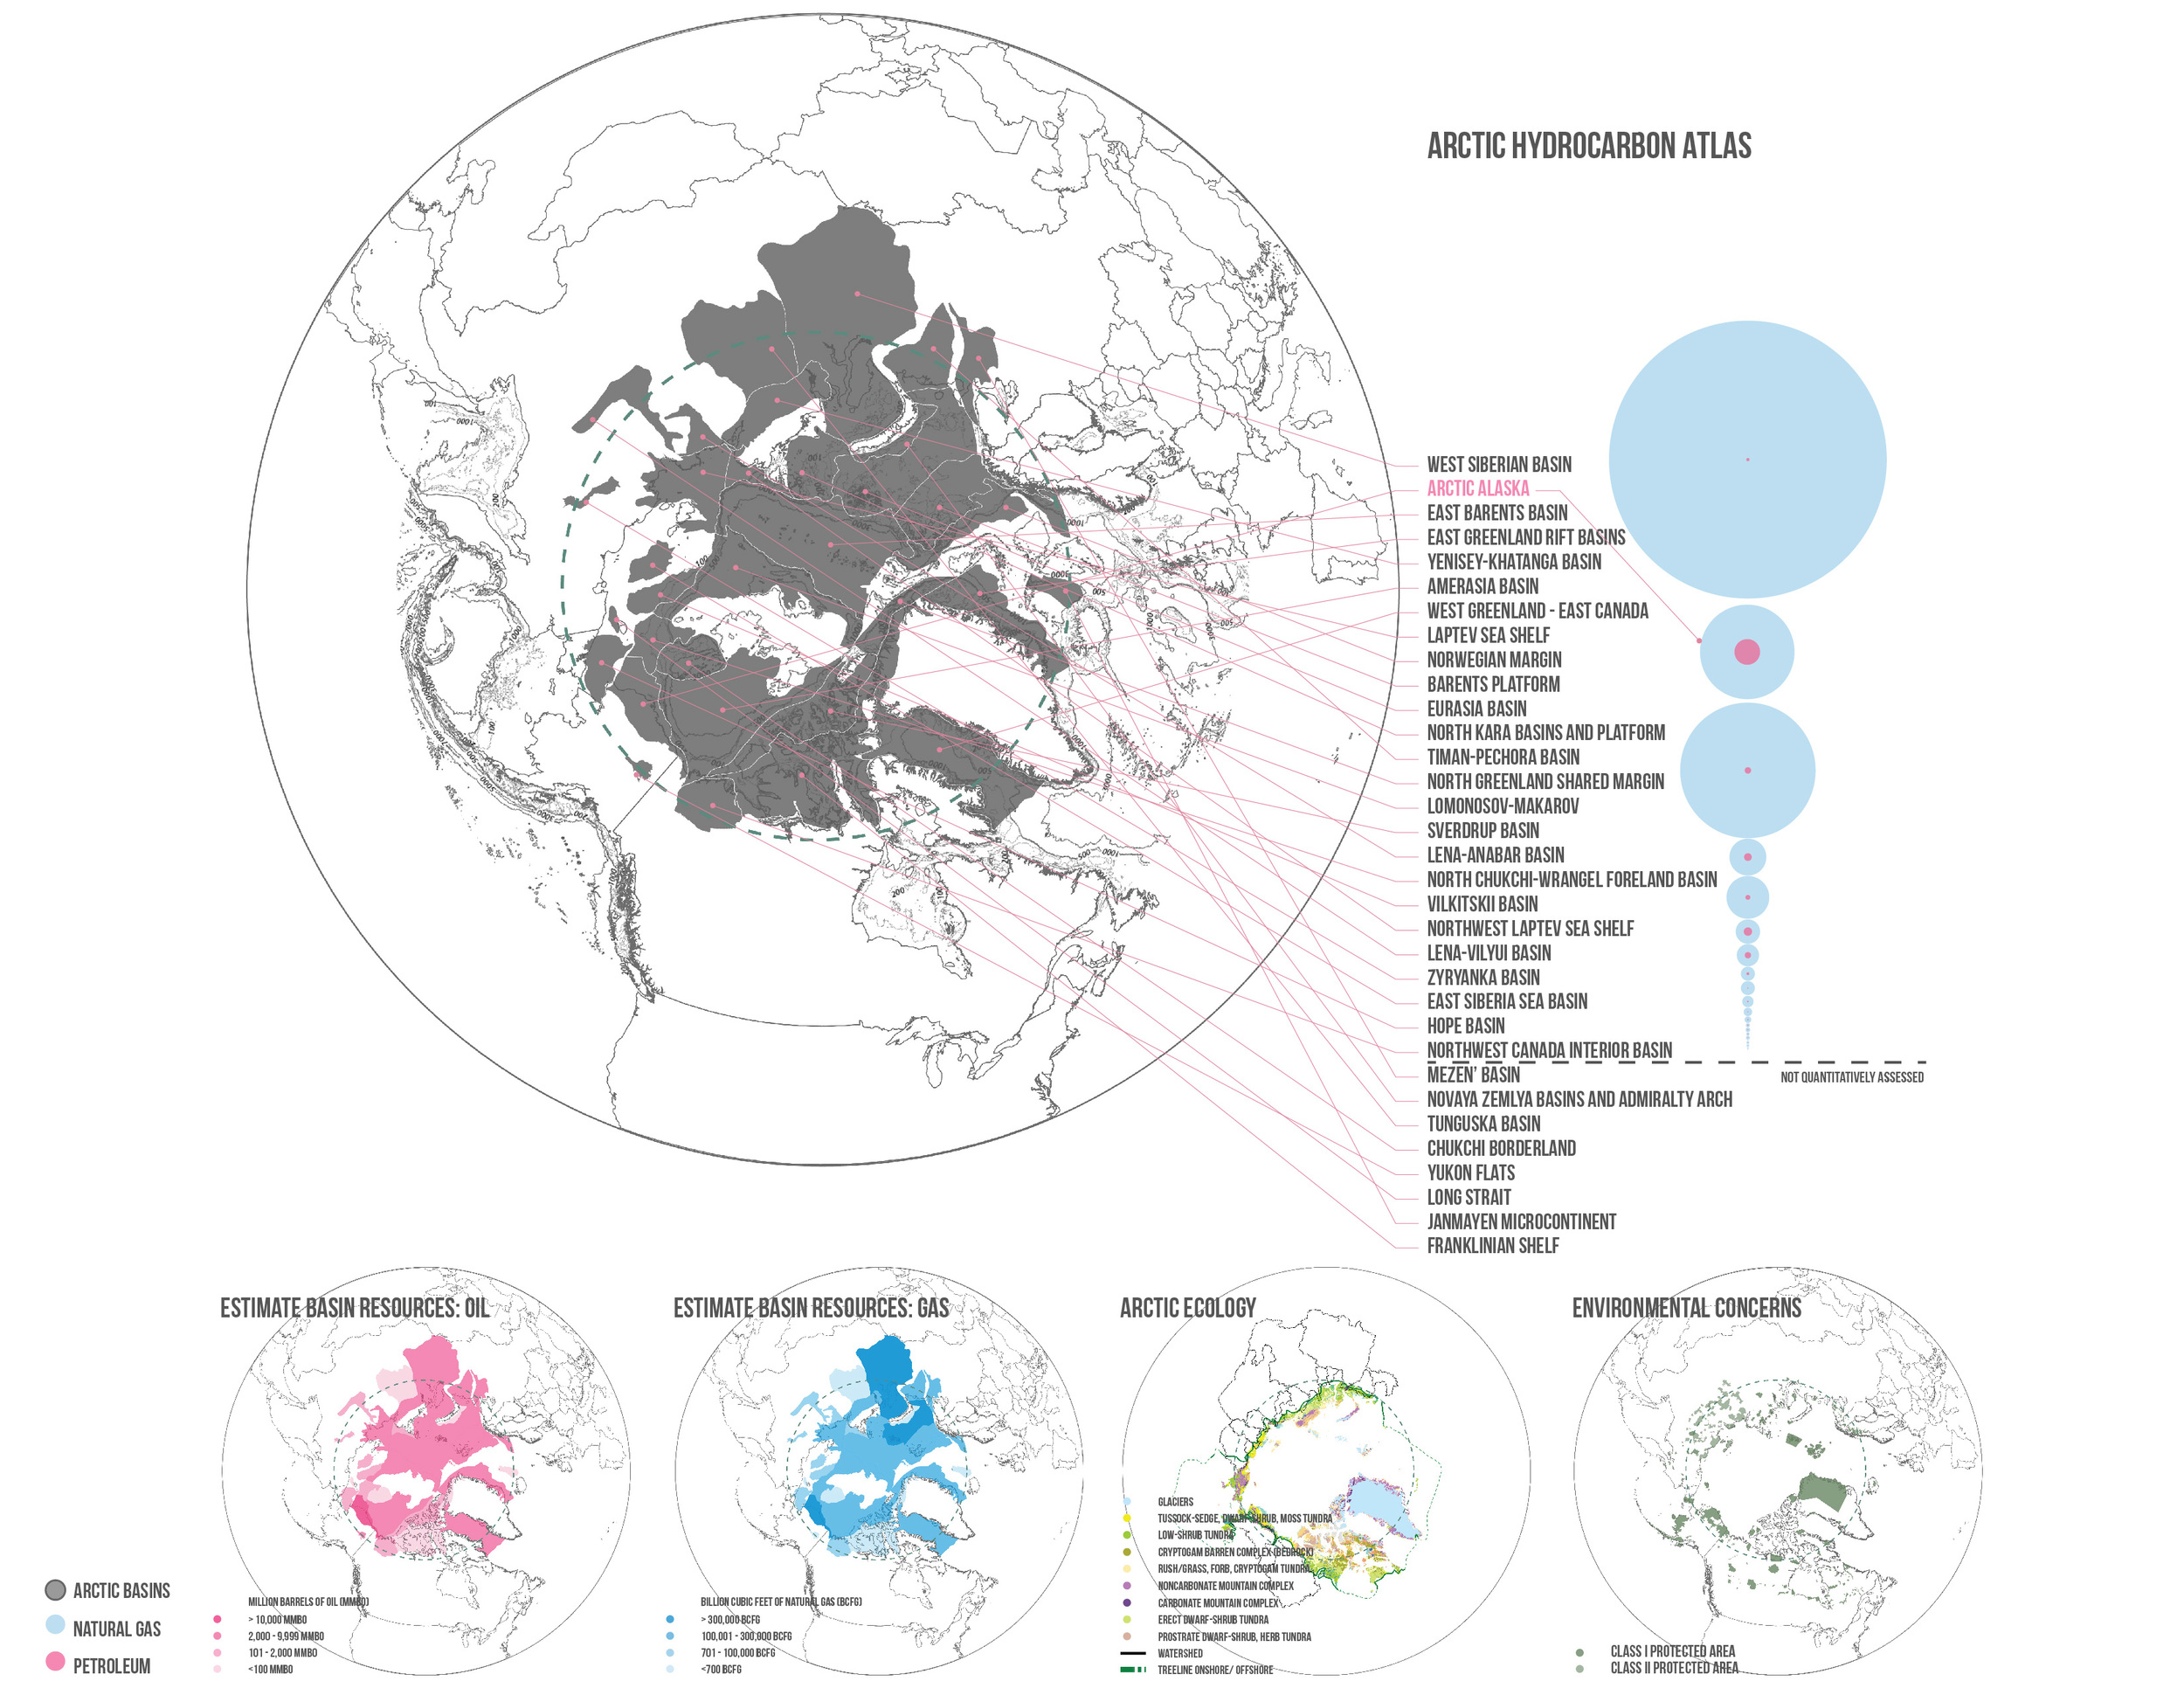
The Race for Arctic Hydrocarbons
9 Billion tons of oil and natural gas lay dormant beneath the Arctic Circle; this is approximately 25% of the global reserves. “27 Billion barrels and 132 trillion cubic feet” of natural gas is estimated to be deposited off of the Northern coasts of Alaska.
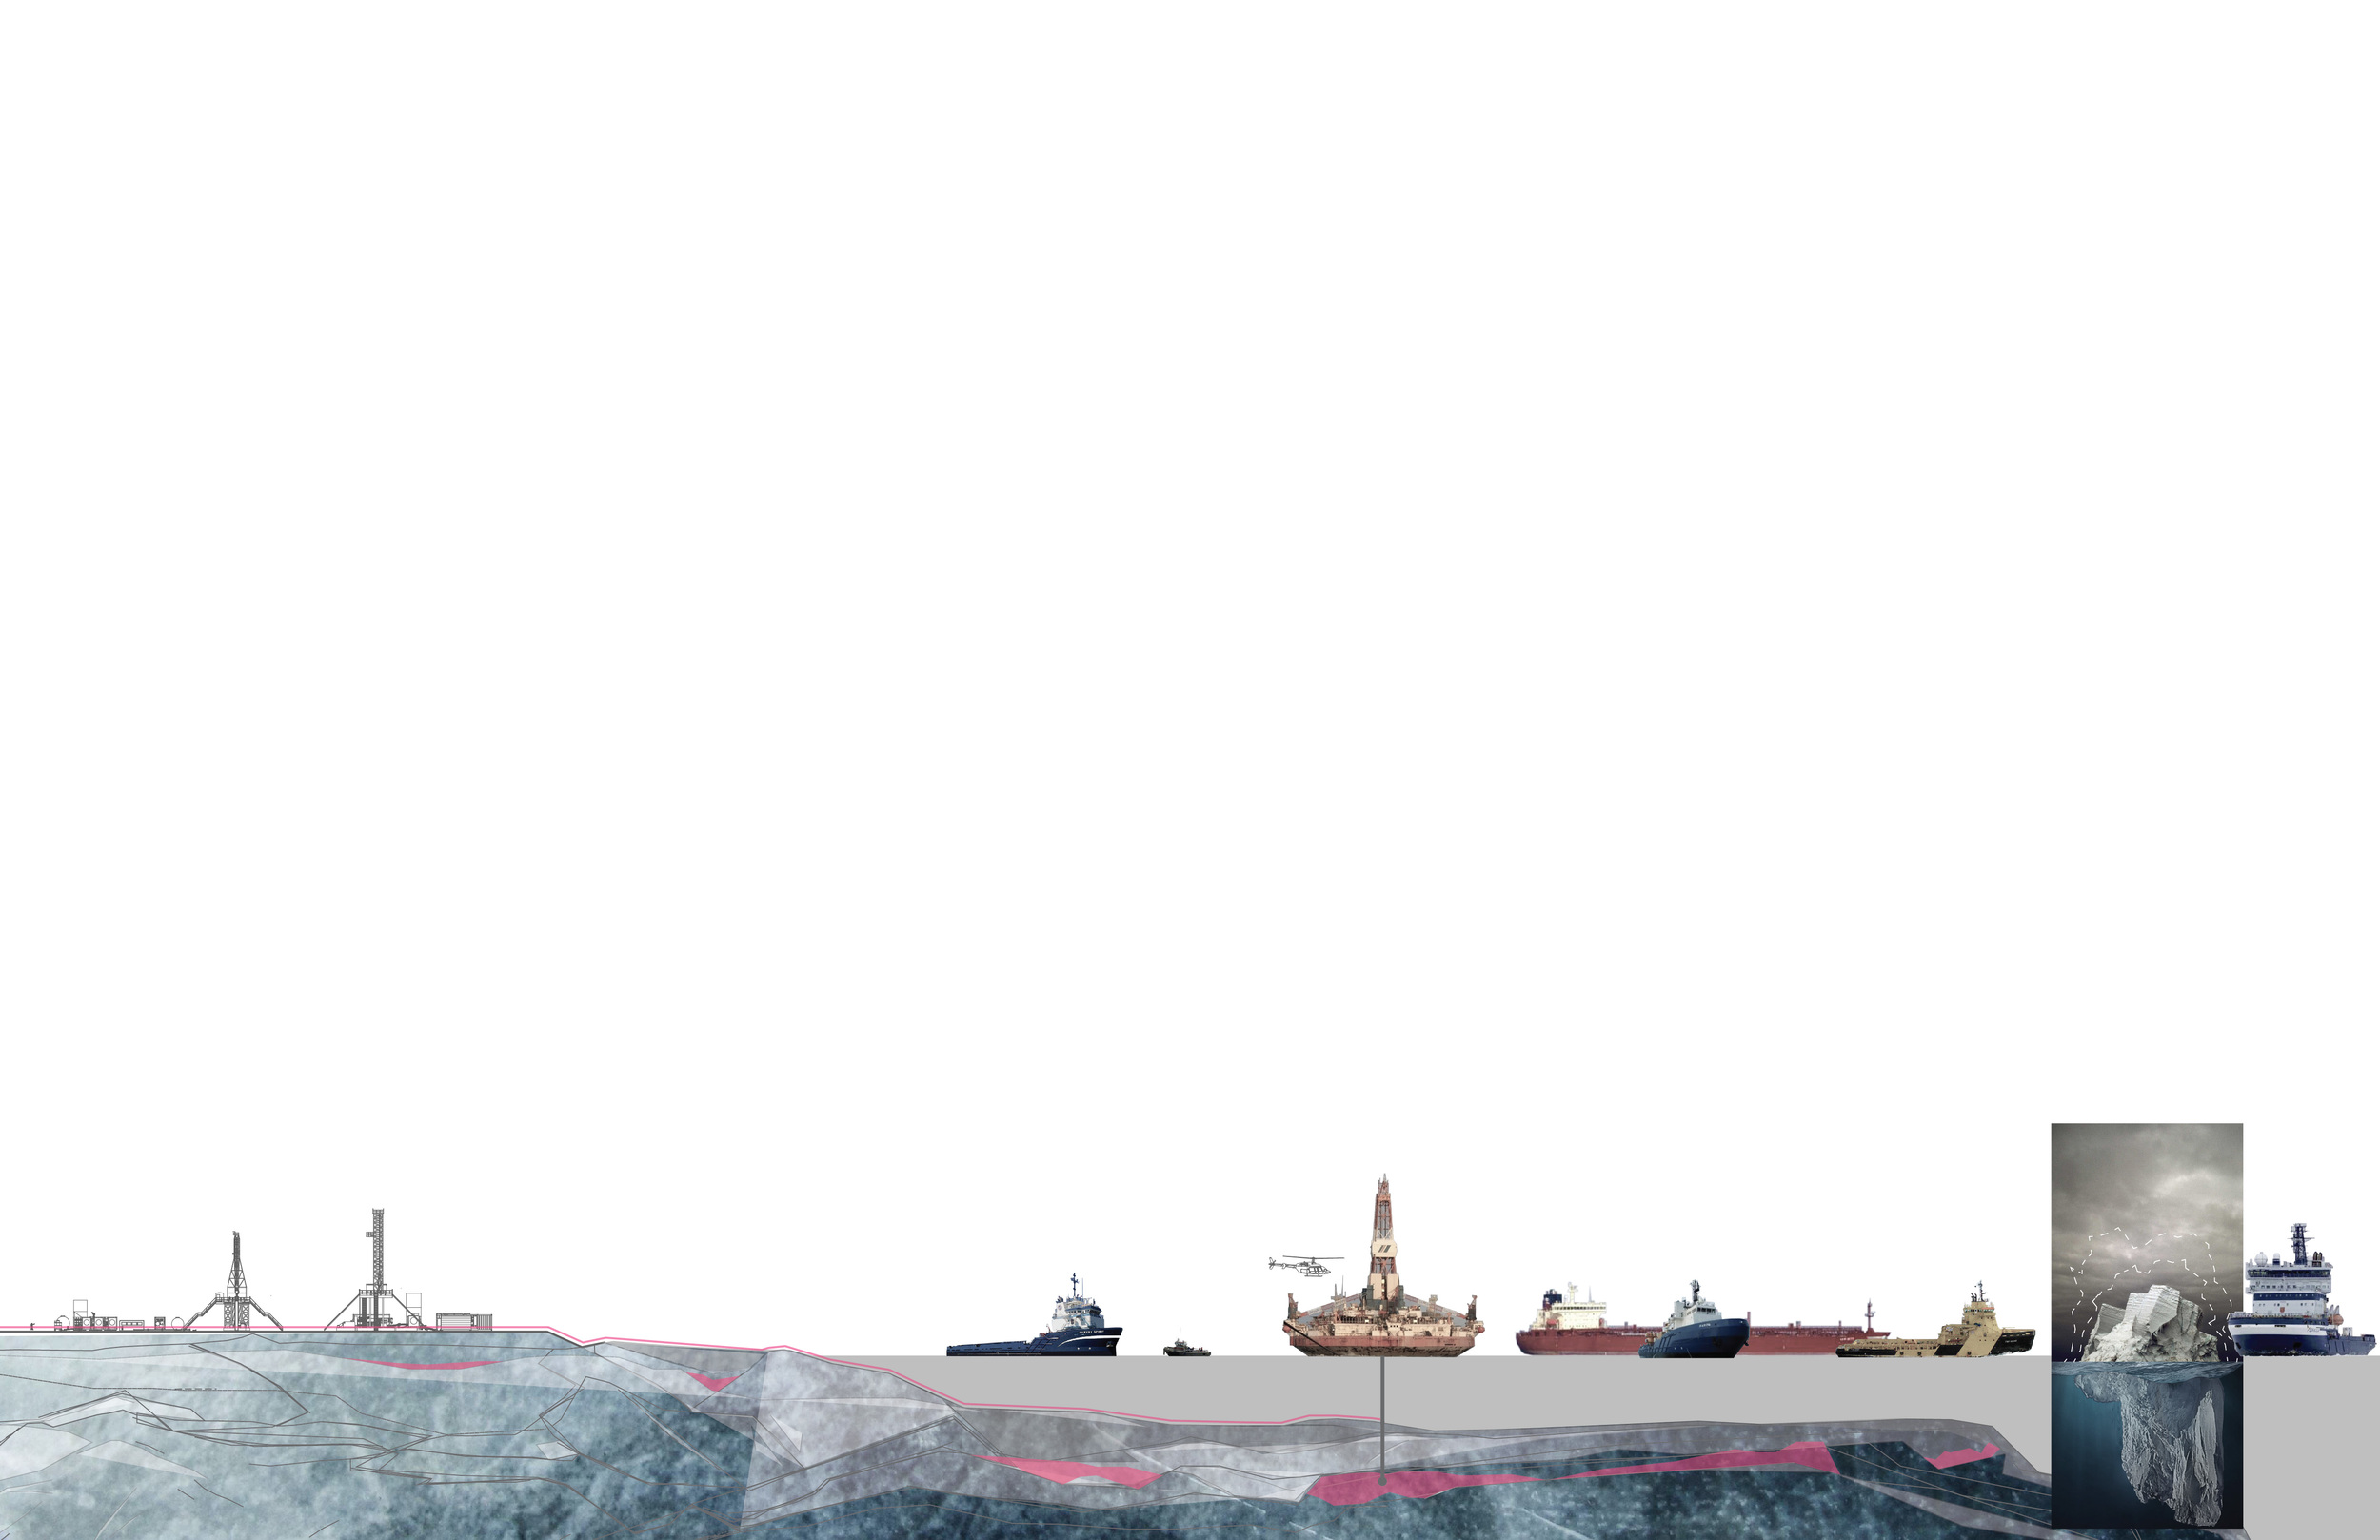
The erosion of ice and technological innovation are making extracting this oil more alluring in recent years. In recent years the ice has reduced in average thickness from four meters in 1950 to two meters in 2012. During the summer months the ice has reduced at much greater distances for longer periods because of warmer summers and melting ice levels. The increasing access the sea floor is making drilling for oil here much more feasible financially.
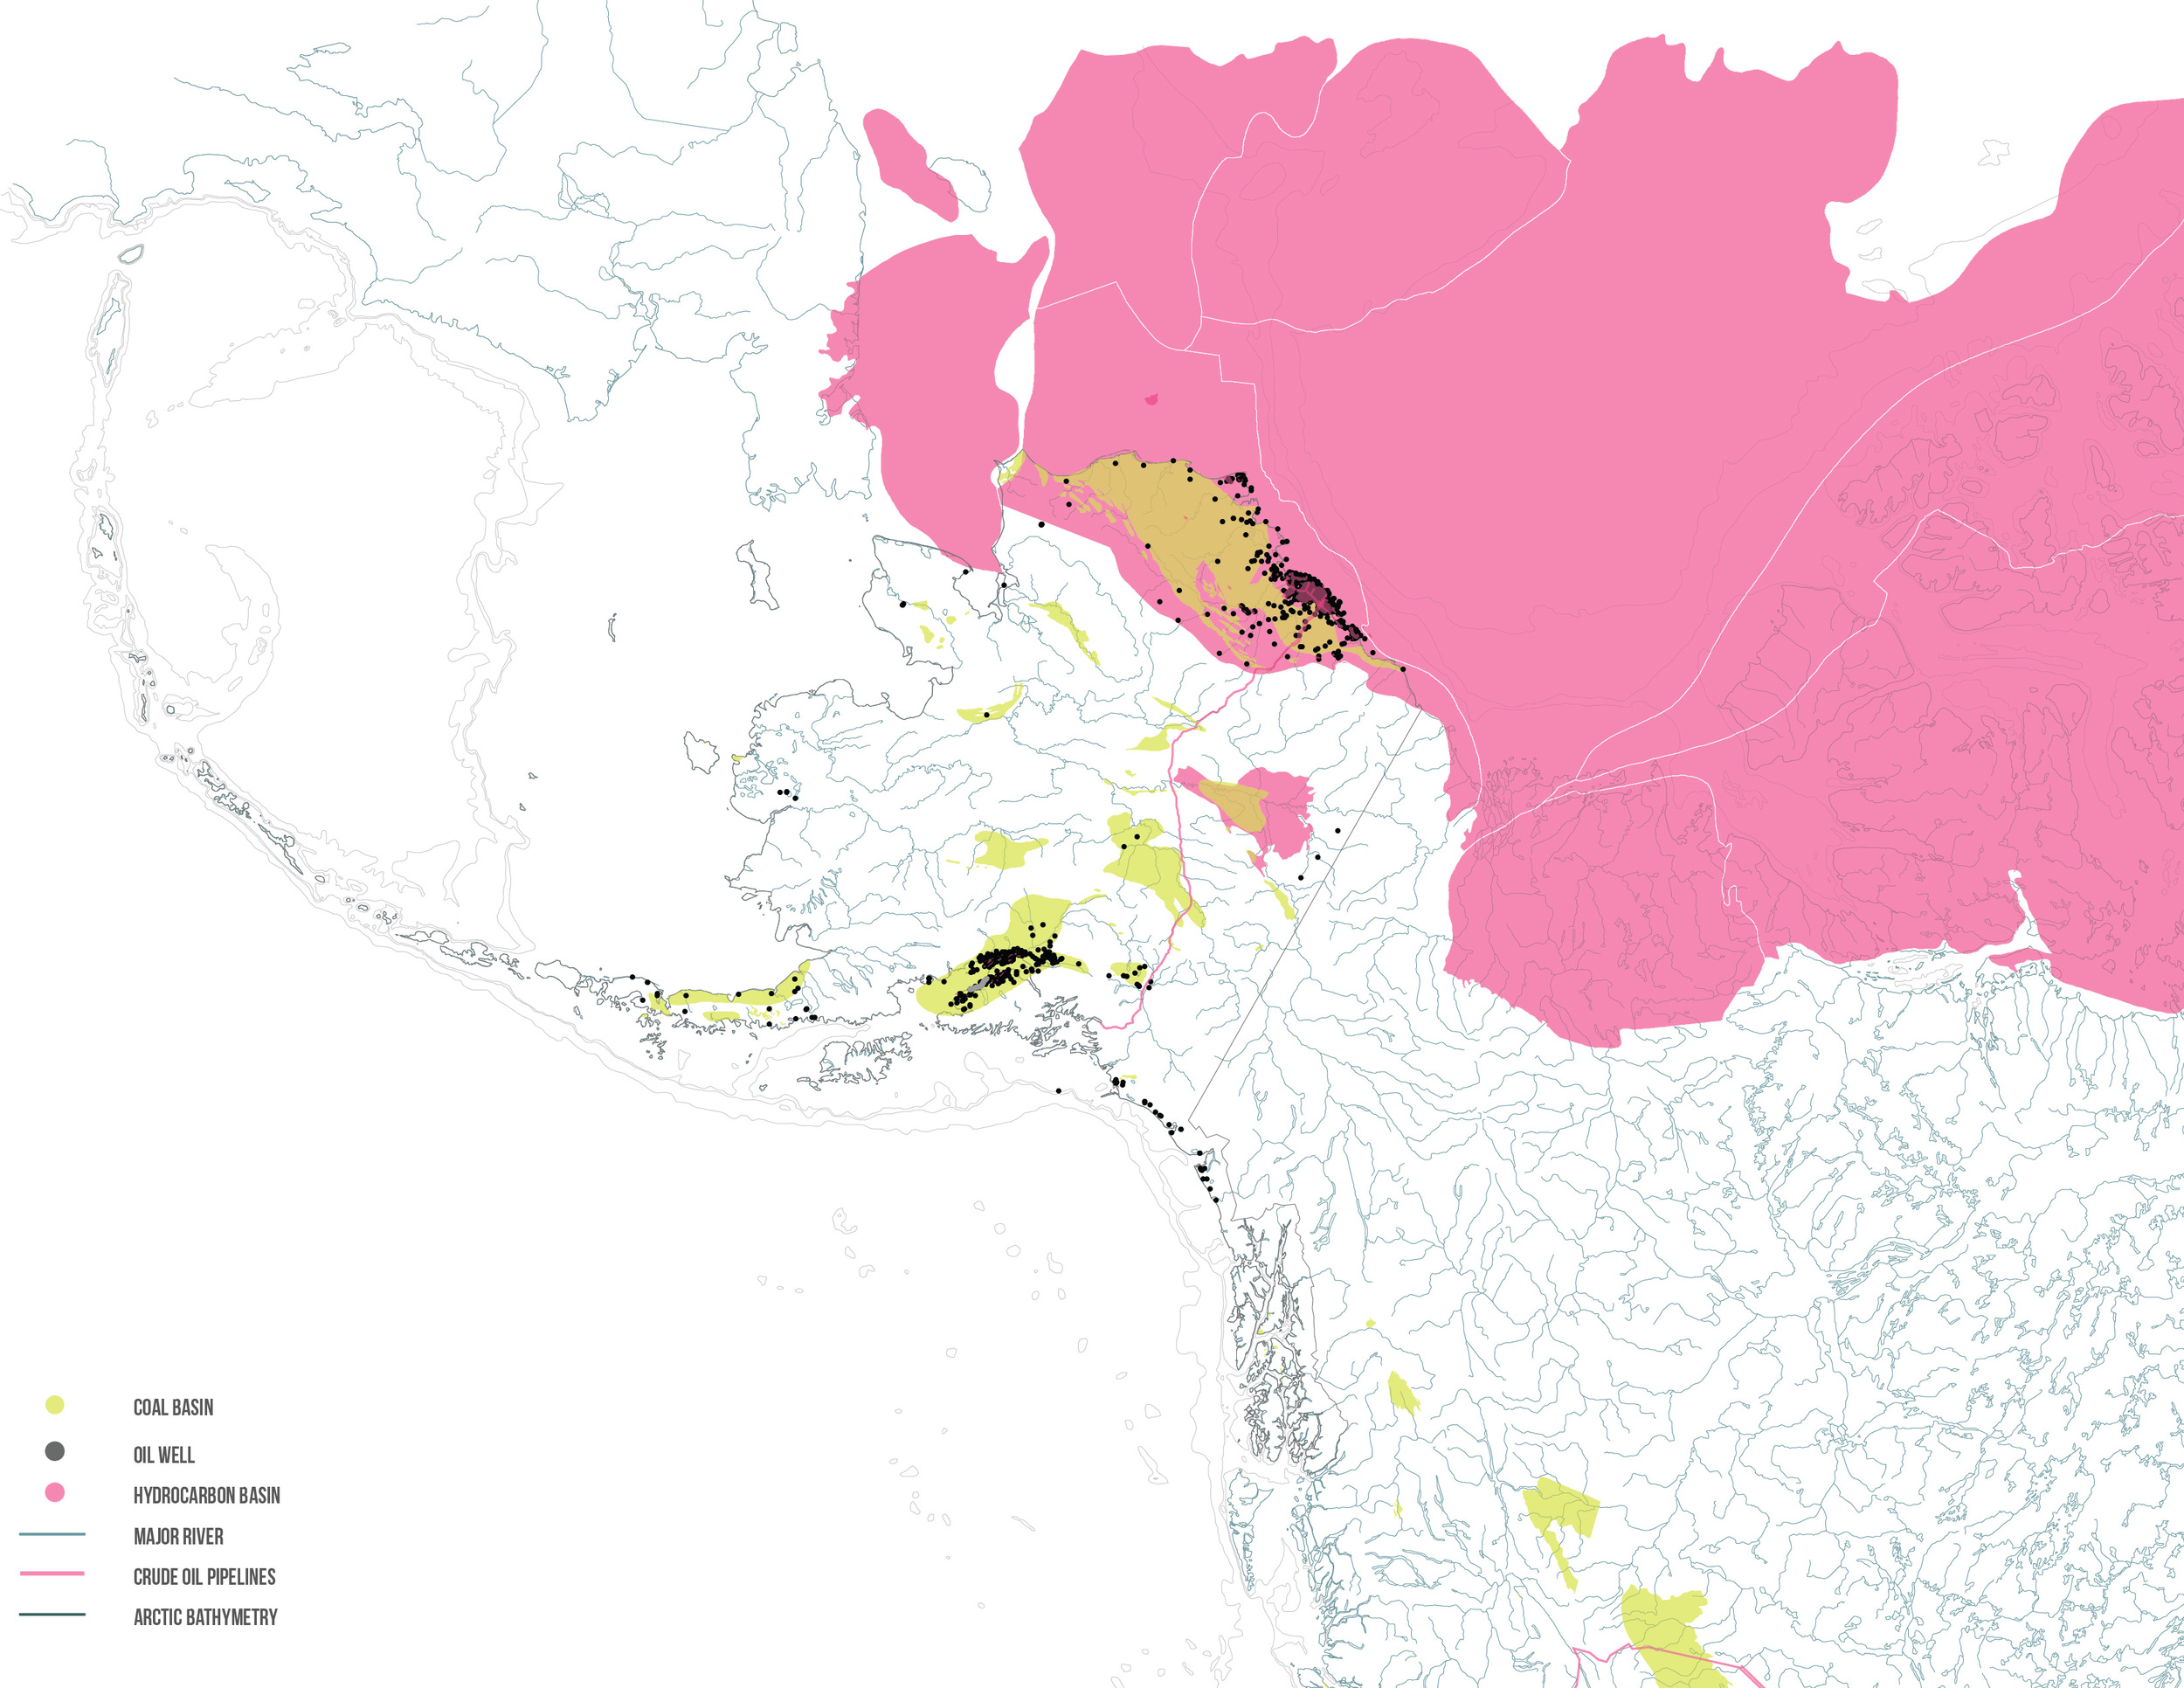
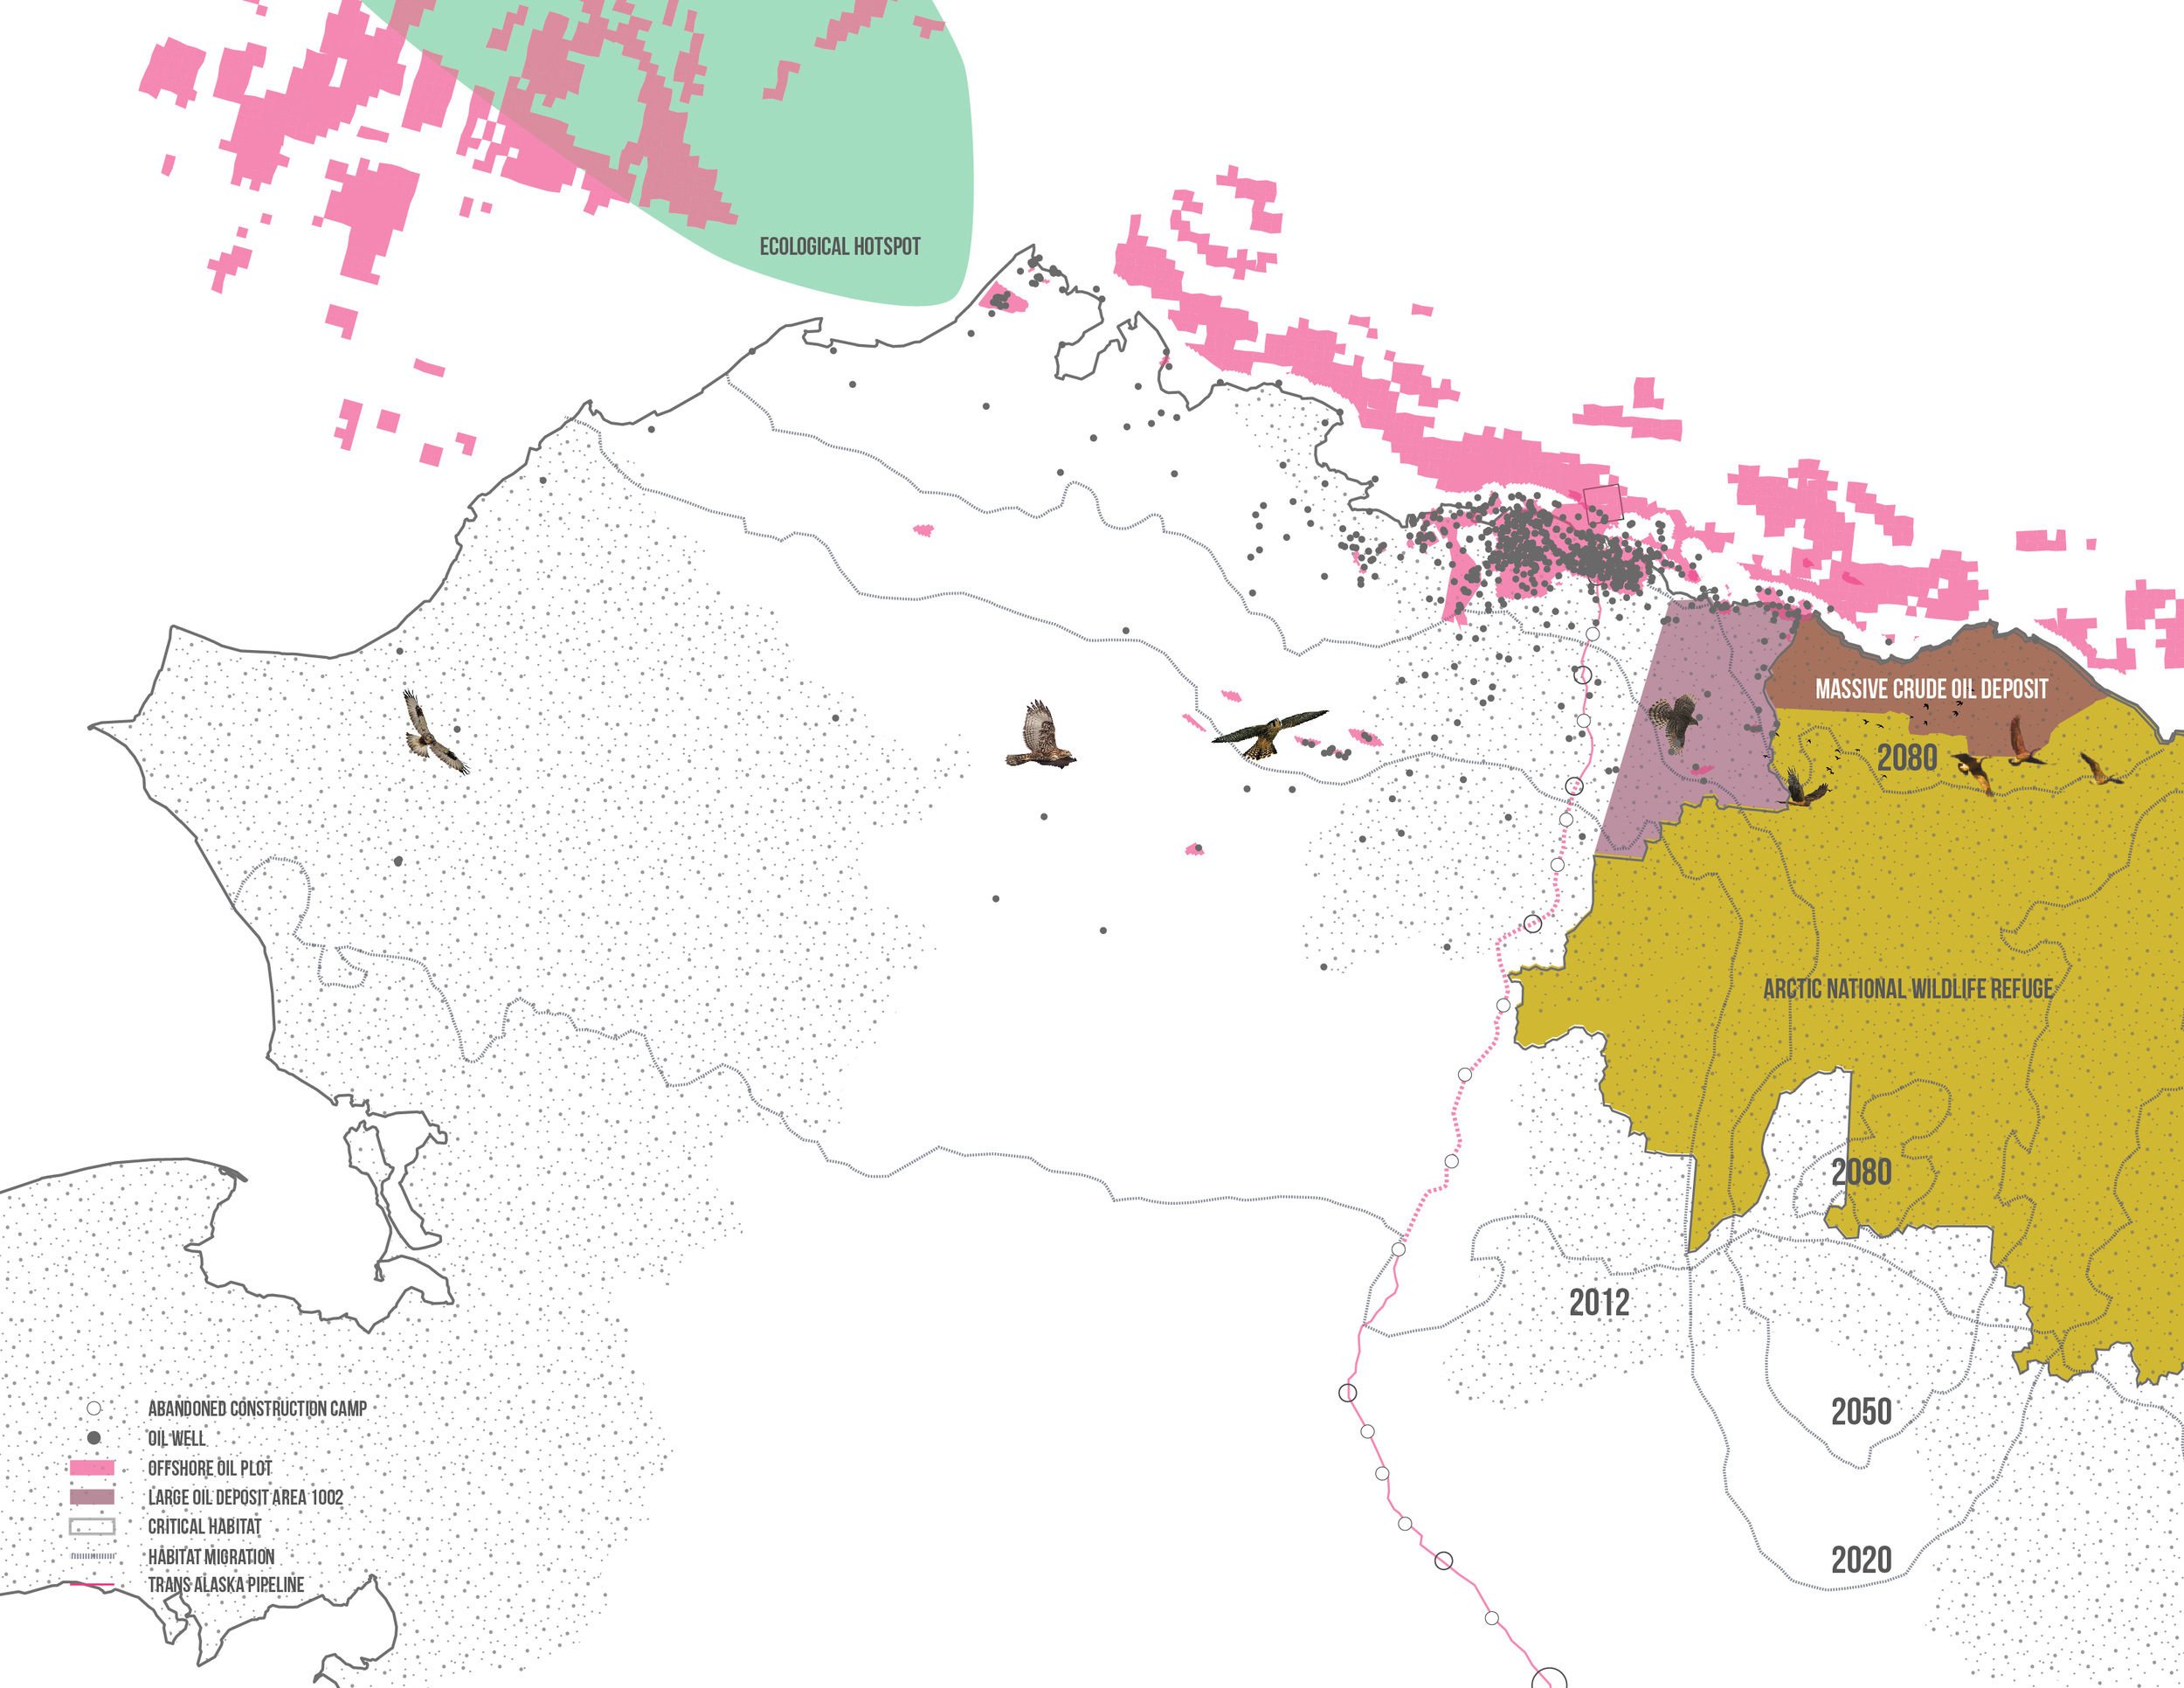
Crude Oil Deposits in the U.S. Arctic
By far, the most valuable hydrocarbon is crude oil. The basins off the coast of Alaska’s North Slope have the largest untapped crude oil deposits in the world. The largest deposits are in relatively shallow waters only a few miles off shore. However, even with the arctic thawing, extraction in this territory can only take place about half of the year.
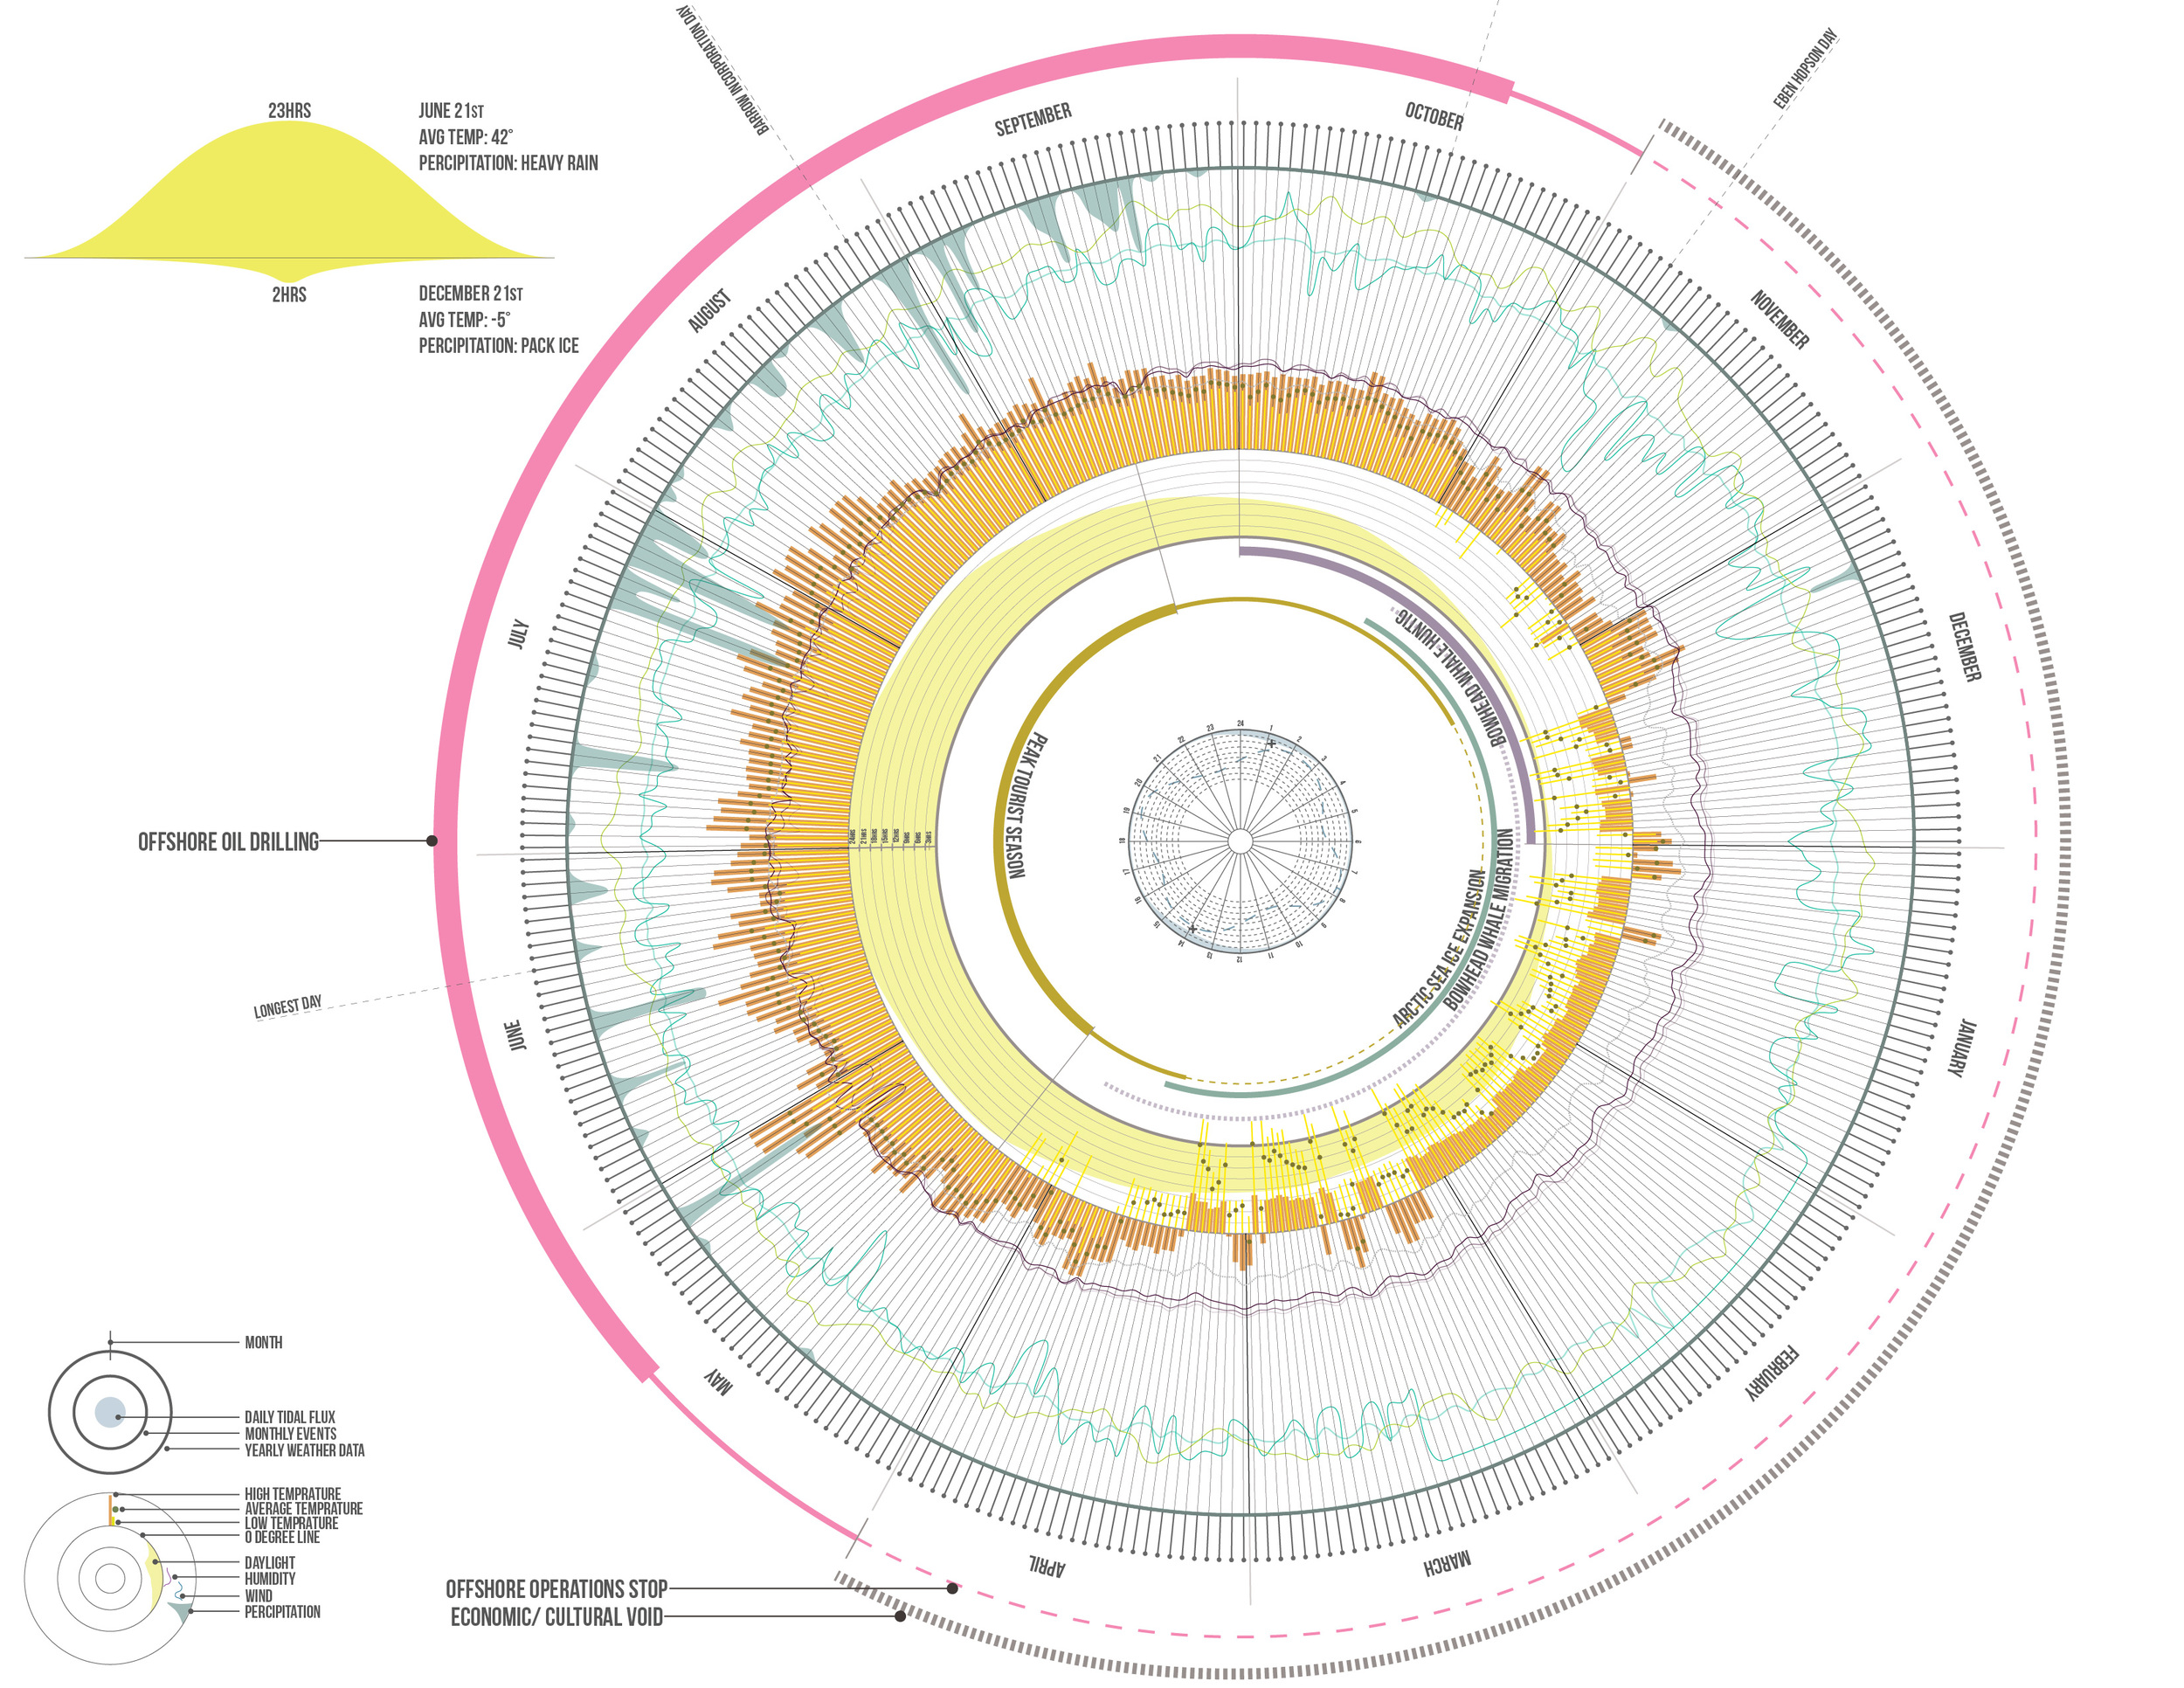
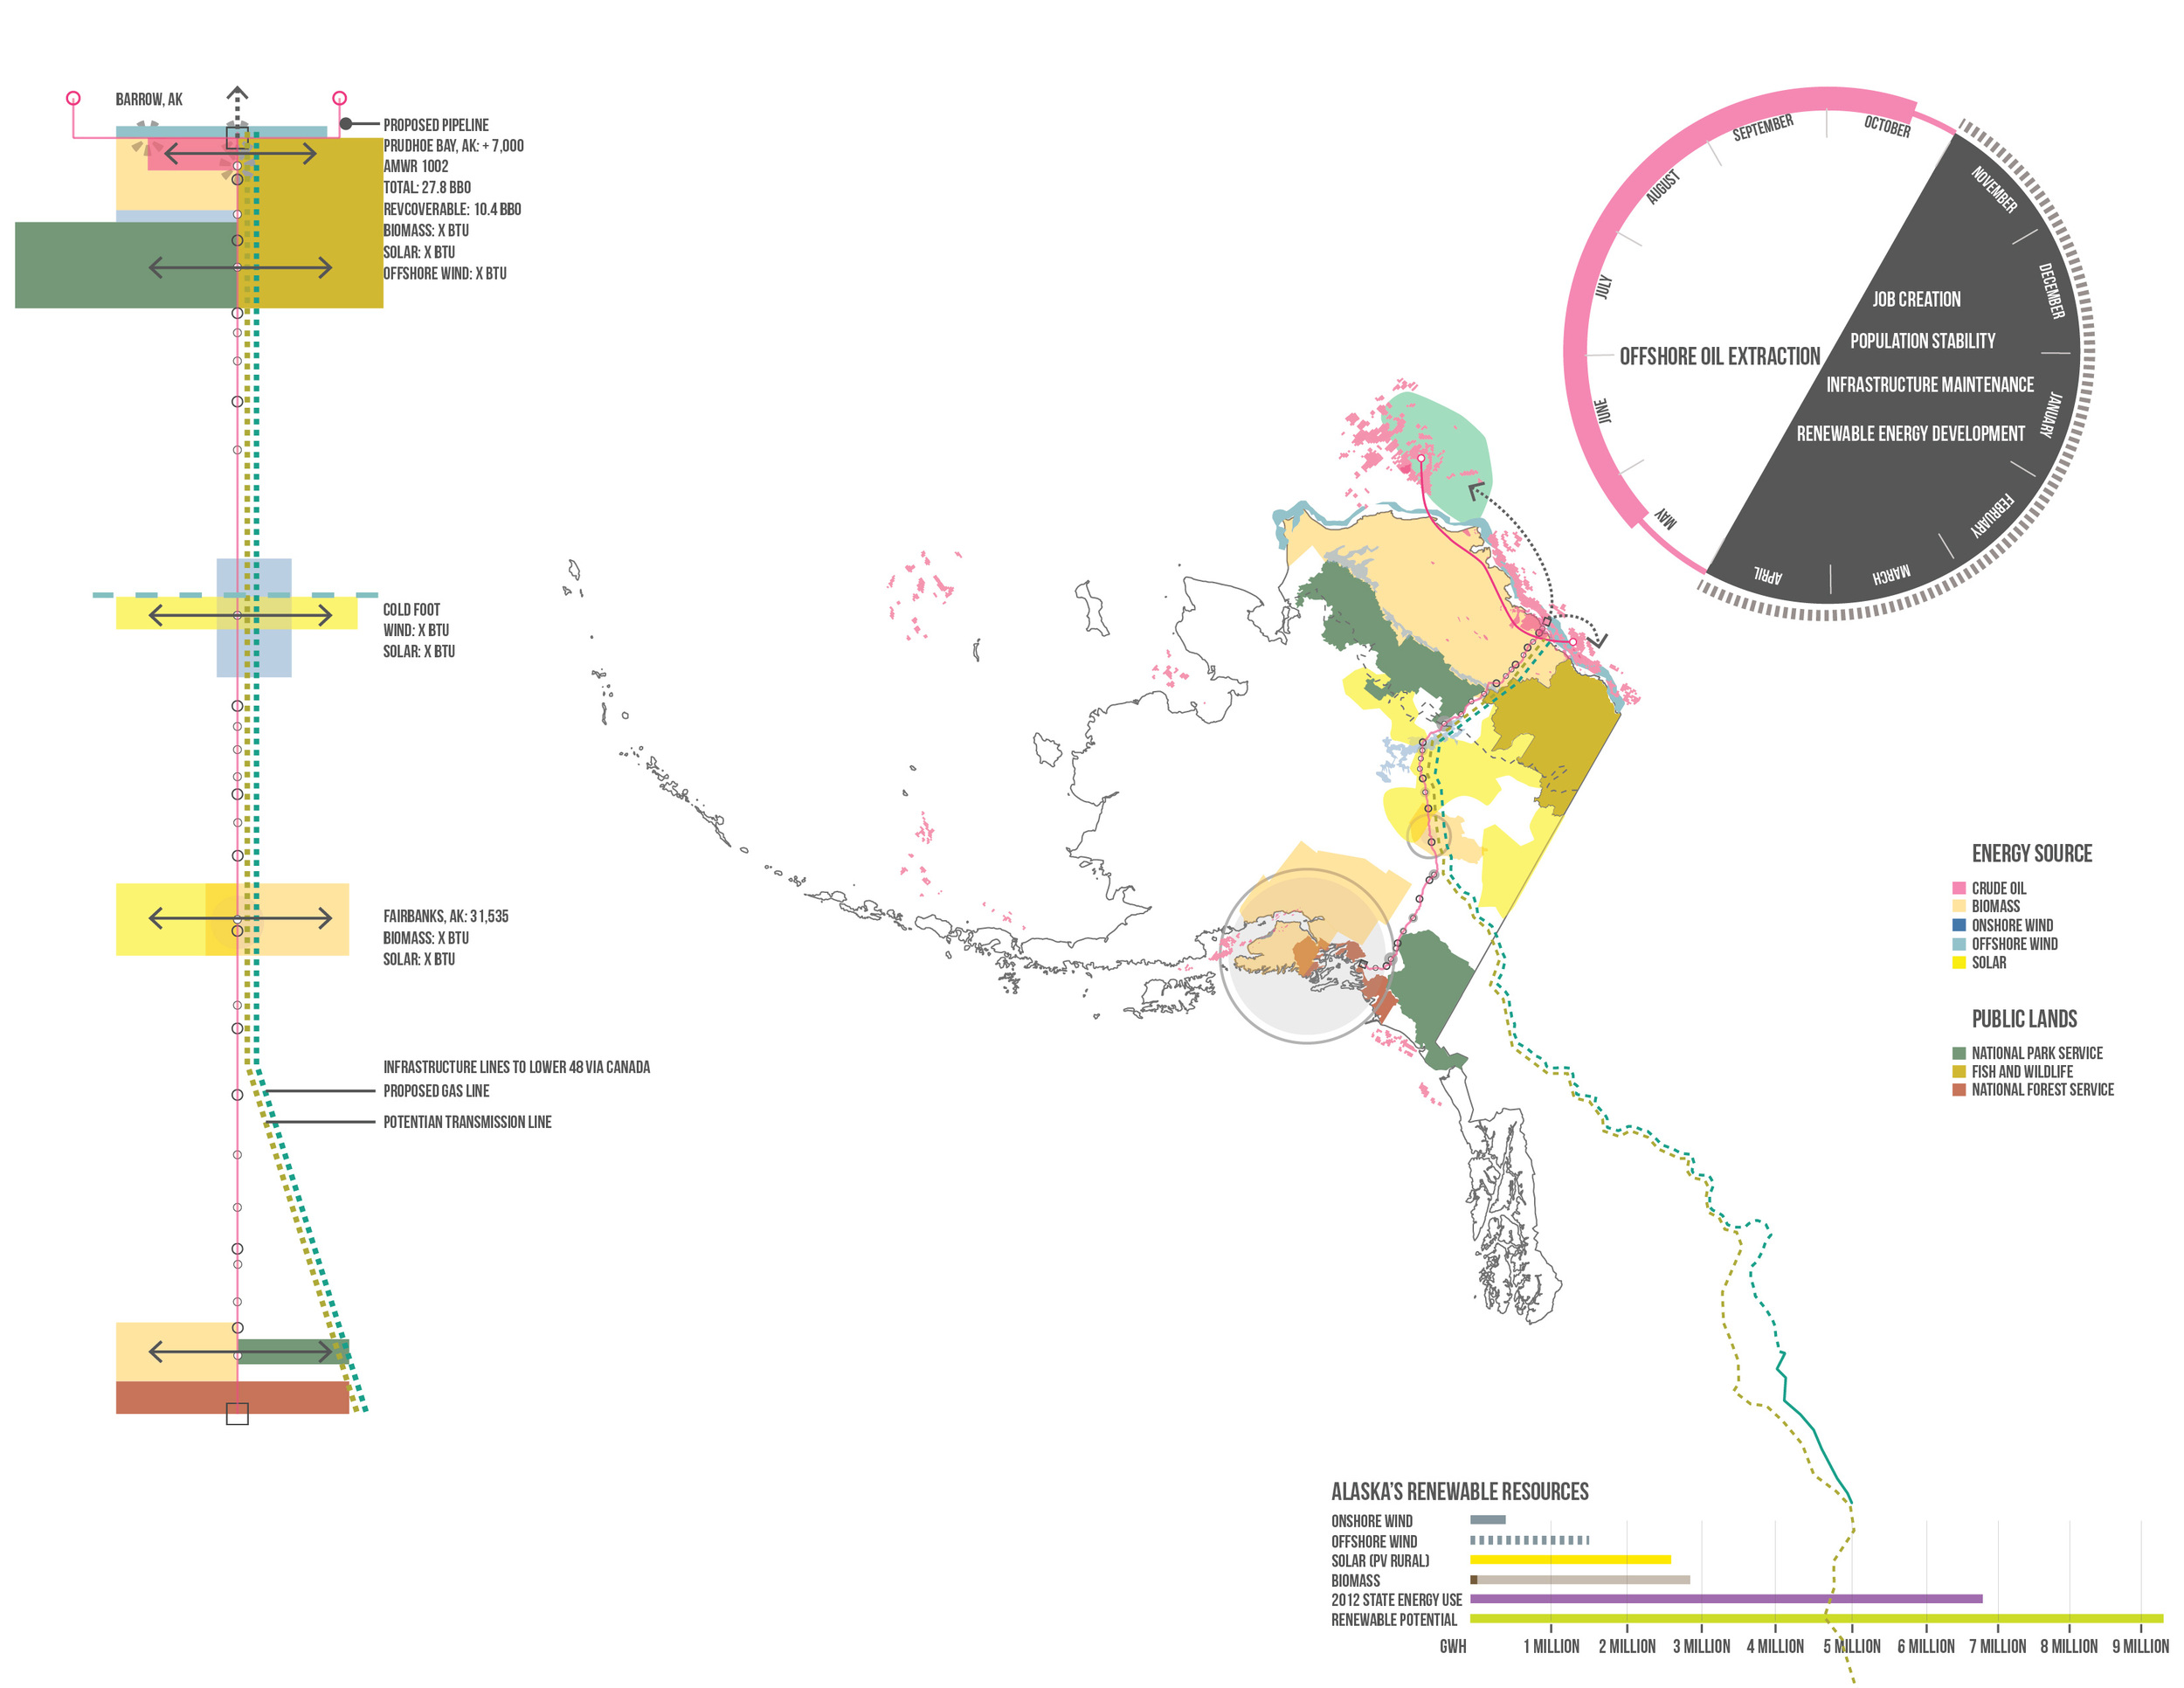
North Slope Psychometric Chart/ Future Oil Extraction Cycle
On Alaska’s Slope winter temperatures commonly drop below 30°F and daylight is as little as 2 hour per day. With major oil operations available only between May and October what will become of the workers and landscape used for operations? How many people are expected to occupy the hydrocarbon landscape in the arctic North?
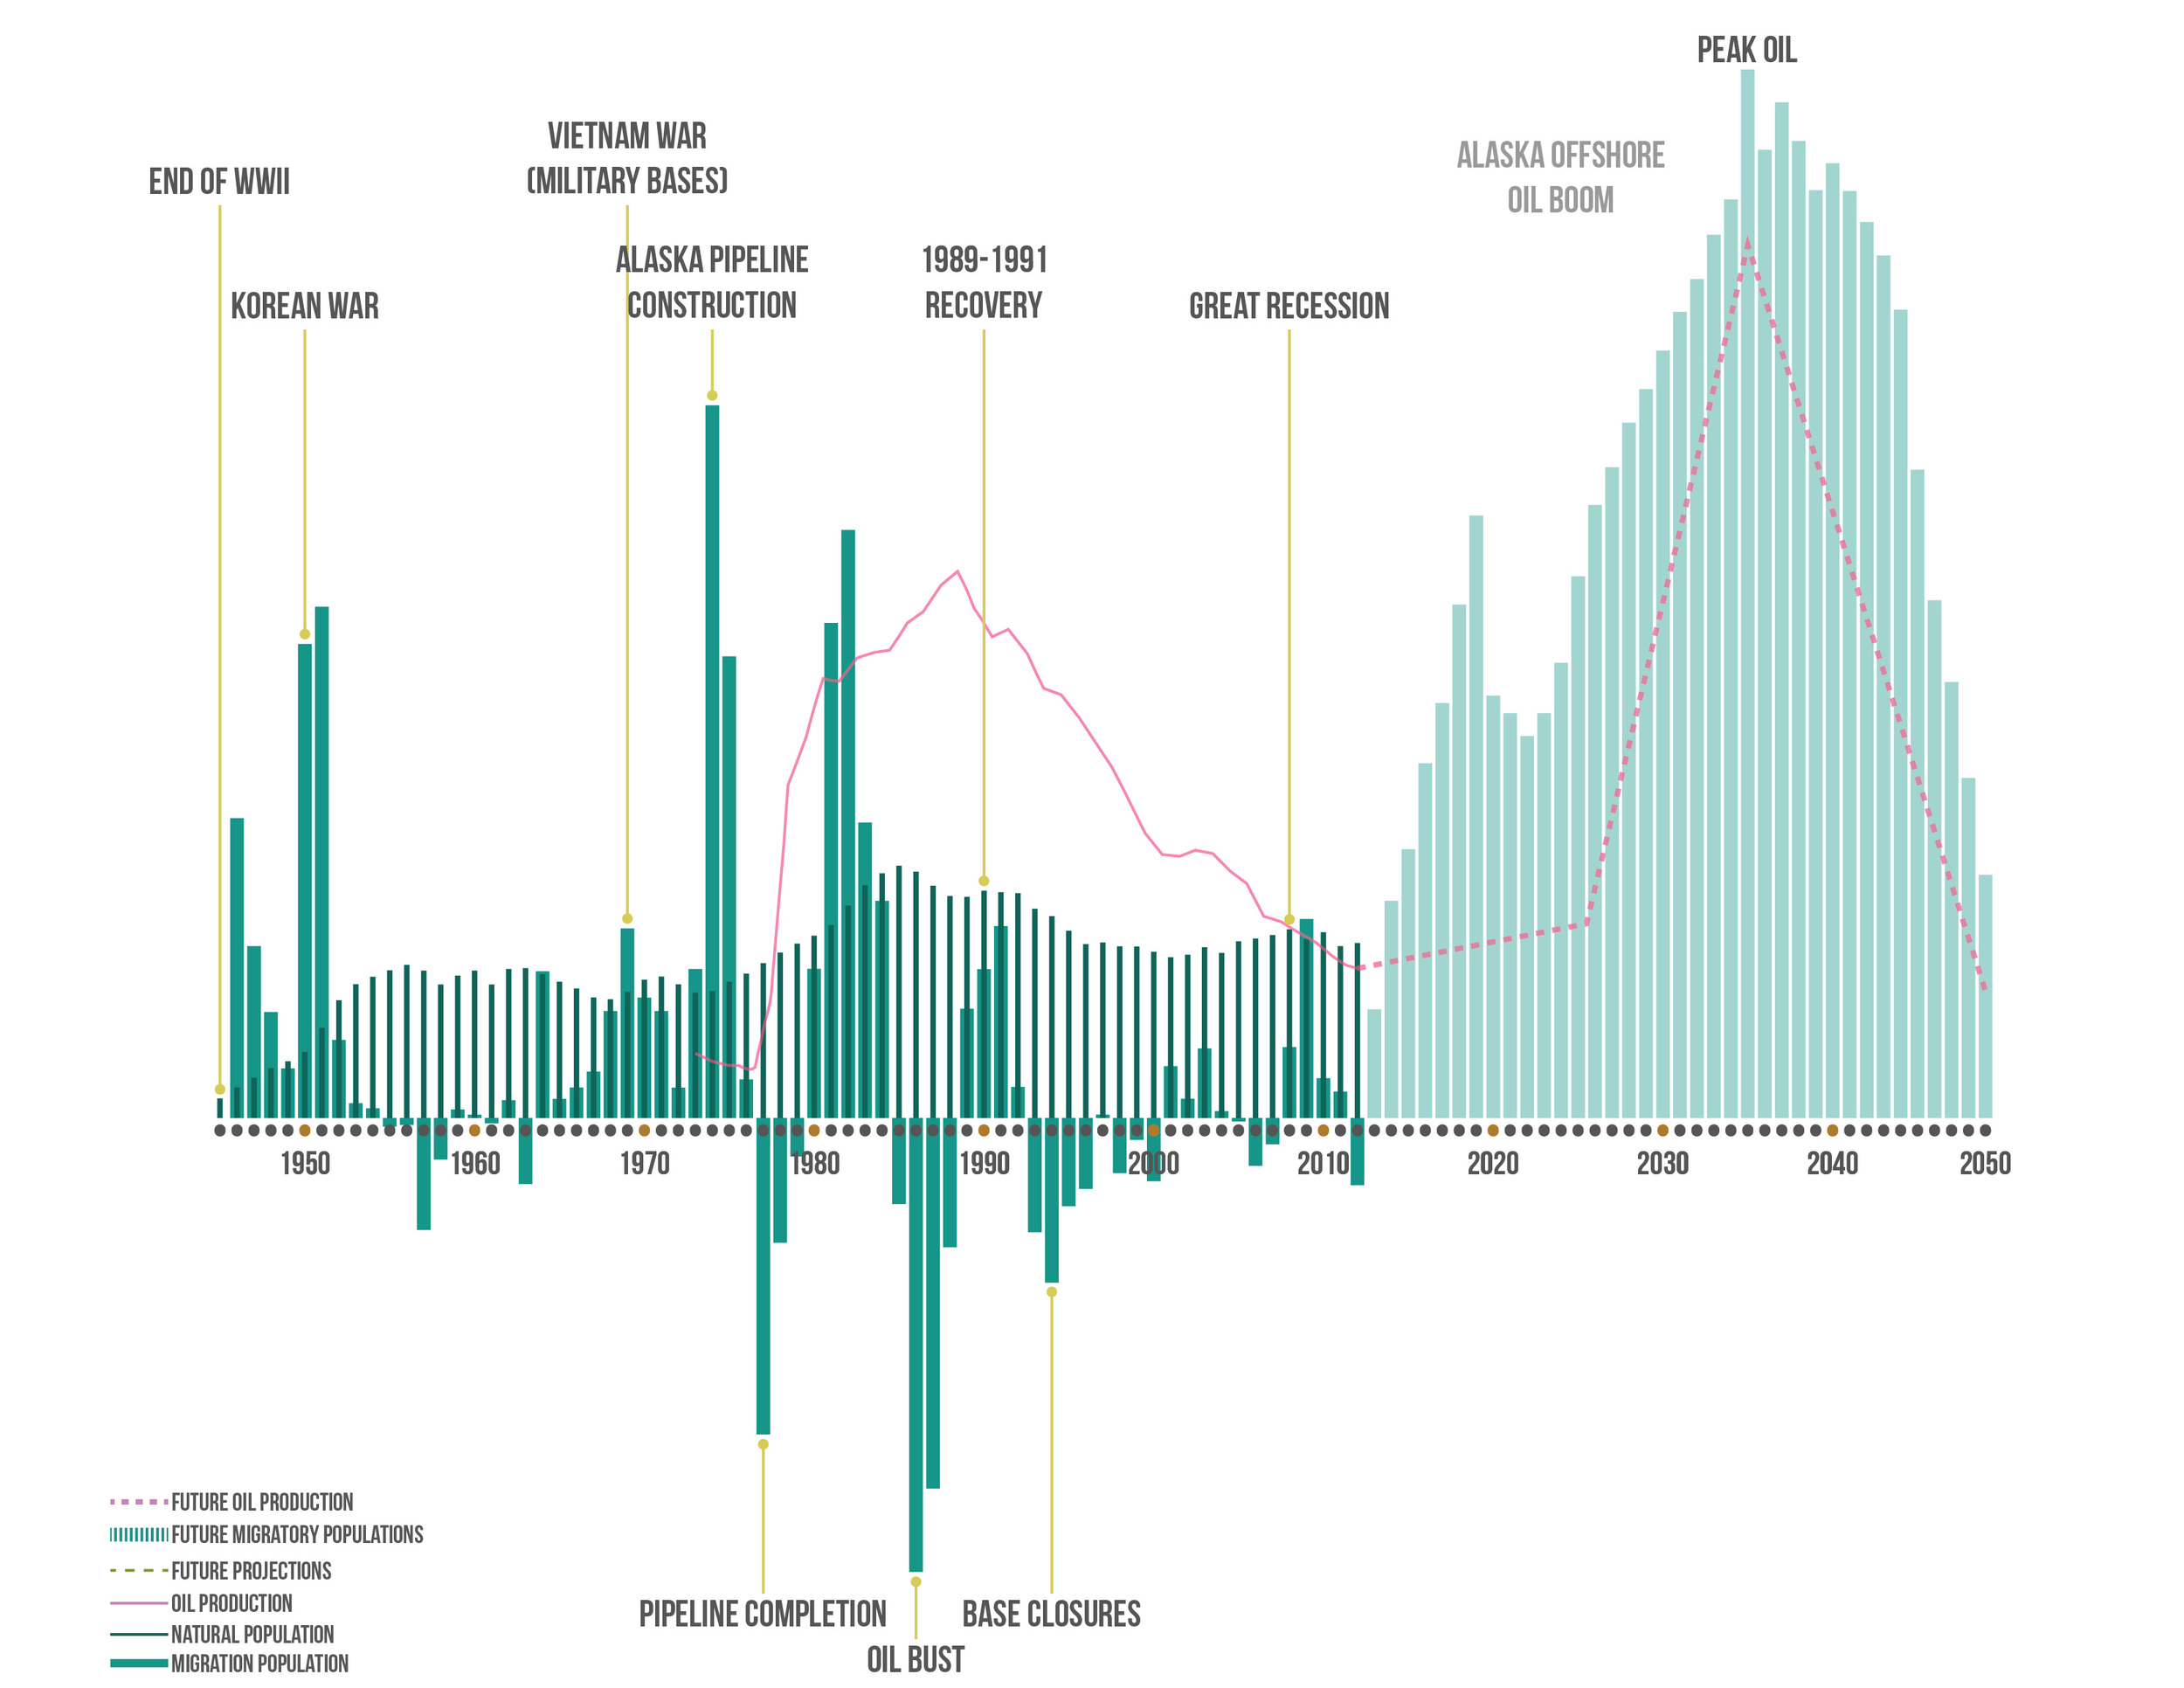
Alaska Oil Migration/ Future Offshore Oil Boom
To understand the future occupation of Alaska’s North Slope we can look to the state’s past oil boom. In the 1970’s migrant workers were positioned across Alaska’s landscape to build the Trans-Alaska Pipeline. The workers employed to build and operate the infrastructure doubled the state’s population. After peak oil the population rapidly fell, leaving behind abandoned infrastructure and an unstable economy. The onshore oil industry at the North Slope makes up 95% of the state’s government revenues by taxing the oil infrastructure. Currently these onshore oil revenues are declining due to the reduction of onshore oil and gas field production. Like many of Americas early wells the wells here are also drying up. The Trans-Alaska pipeline that once supplied America with between 20% and 25% of its crude oil is now flowing at 1/3 the volume.
The future population and offshore hydrocarbon resources will experience a very similar ebb and flows to Alaska’s past. Alaska is once again about to experience a large and expeditious increase in population because of the impending petroleum extraction in the arctic. The peak oil extraction in north Alaskan seas are expected to take place in approximately 30-40 years. The current baseline population predictions in Alaska are expected to naturally rise from 714,142 to 915,211 (13%). This estimate does not include projections related to the rapid expansion of the petroleum industry. Based on previous fluctuations related to hydrocarbon extraction here, I estimate that the current projections will see an increase of an additional 200 to 500 percent. A portion of this population however, will be transient and temporary. How can population growth projections alter the way we think about installing and positioning future oil?
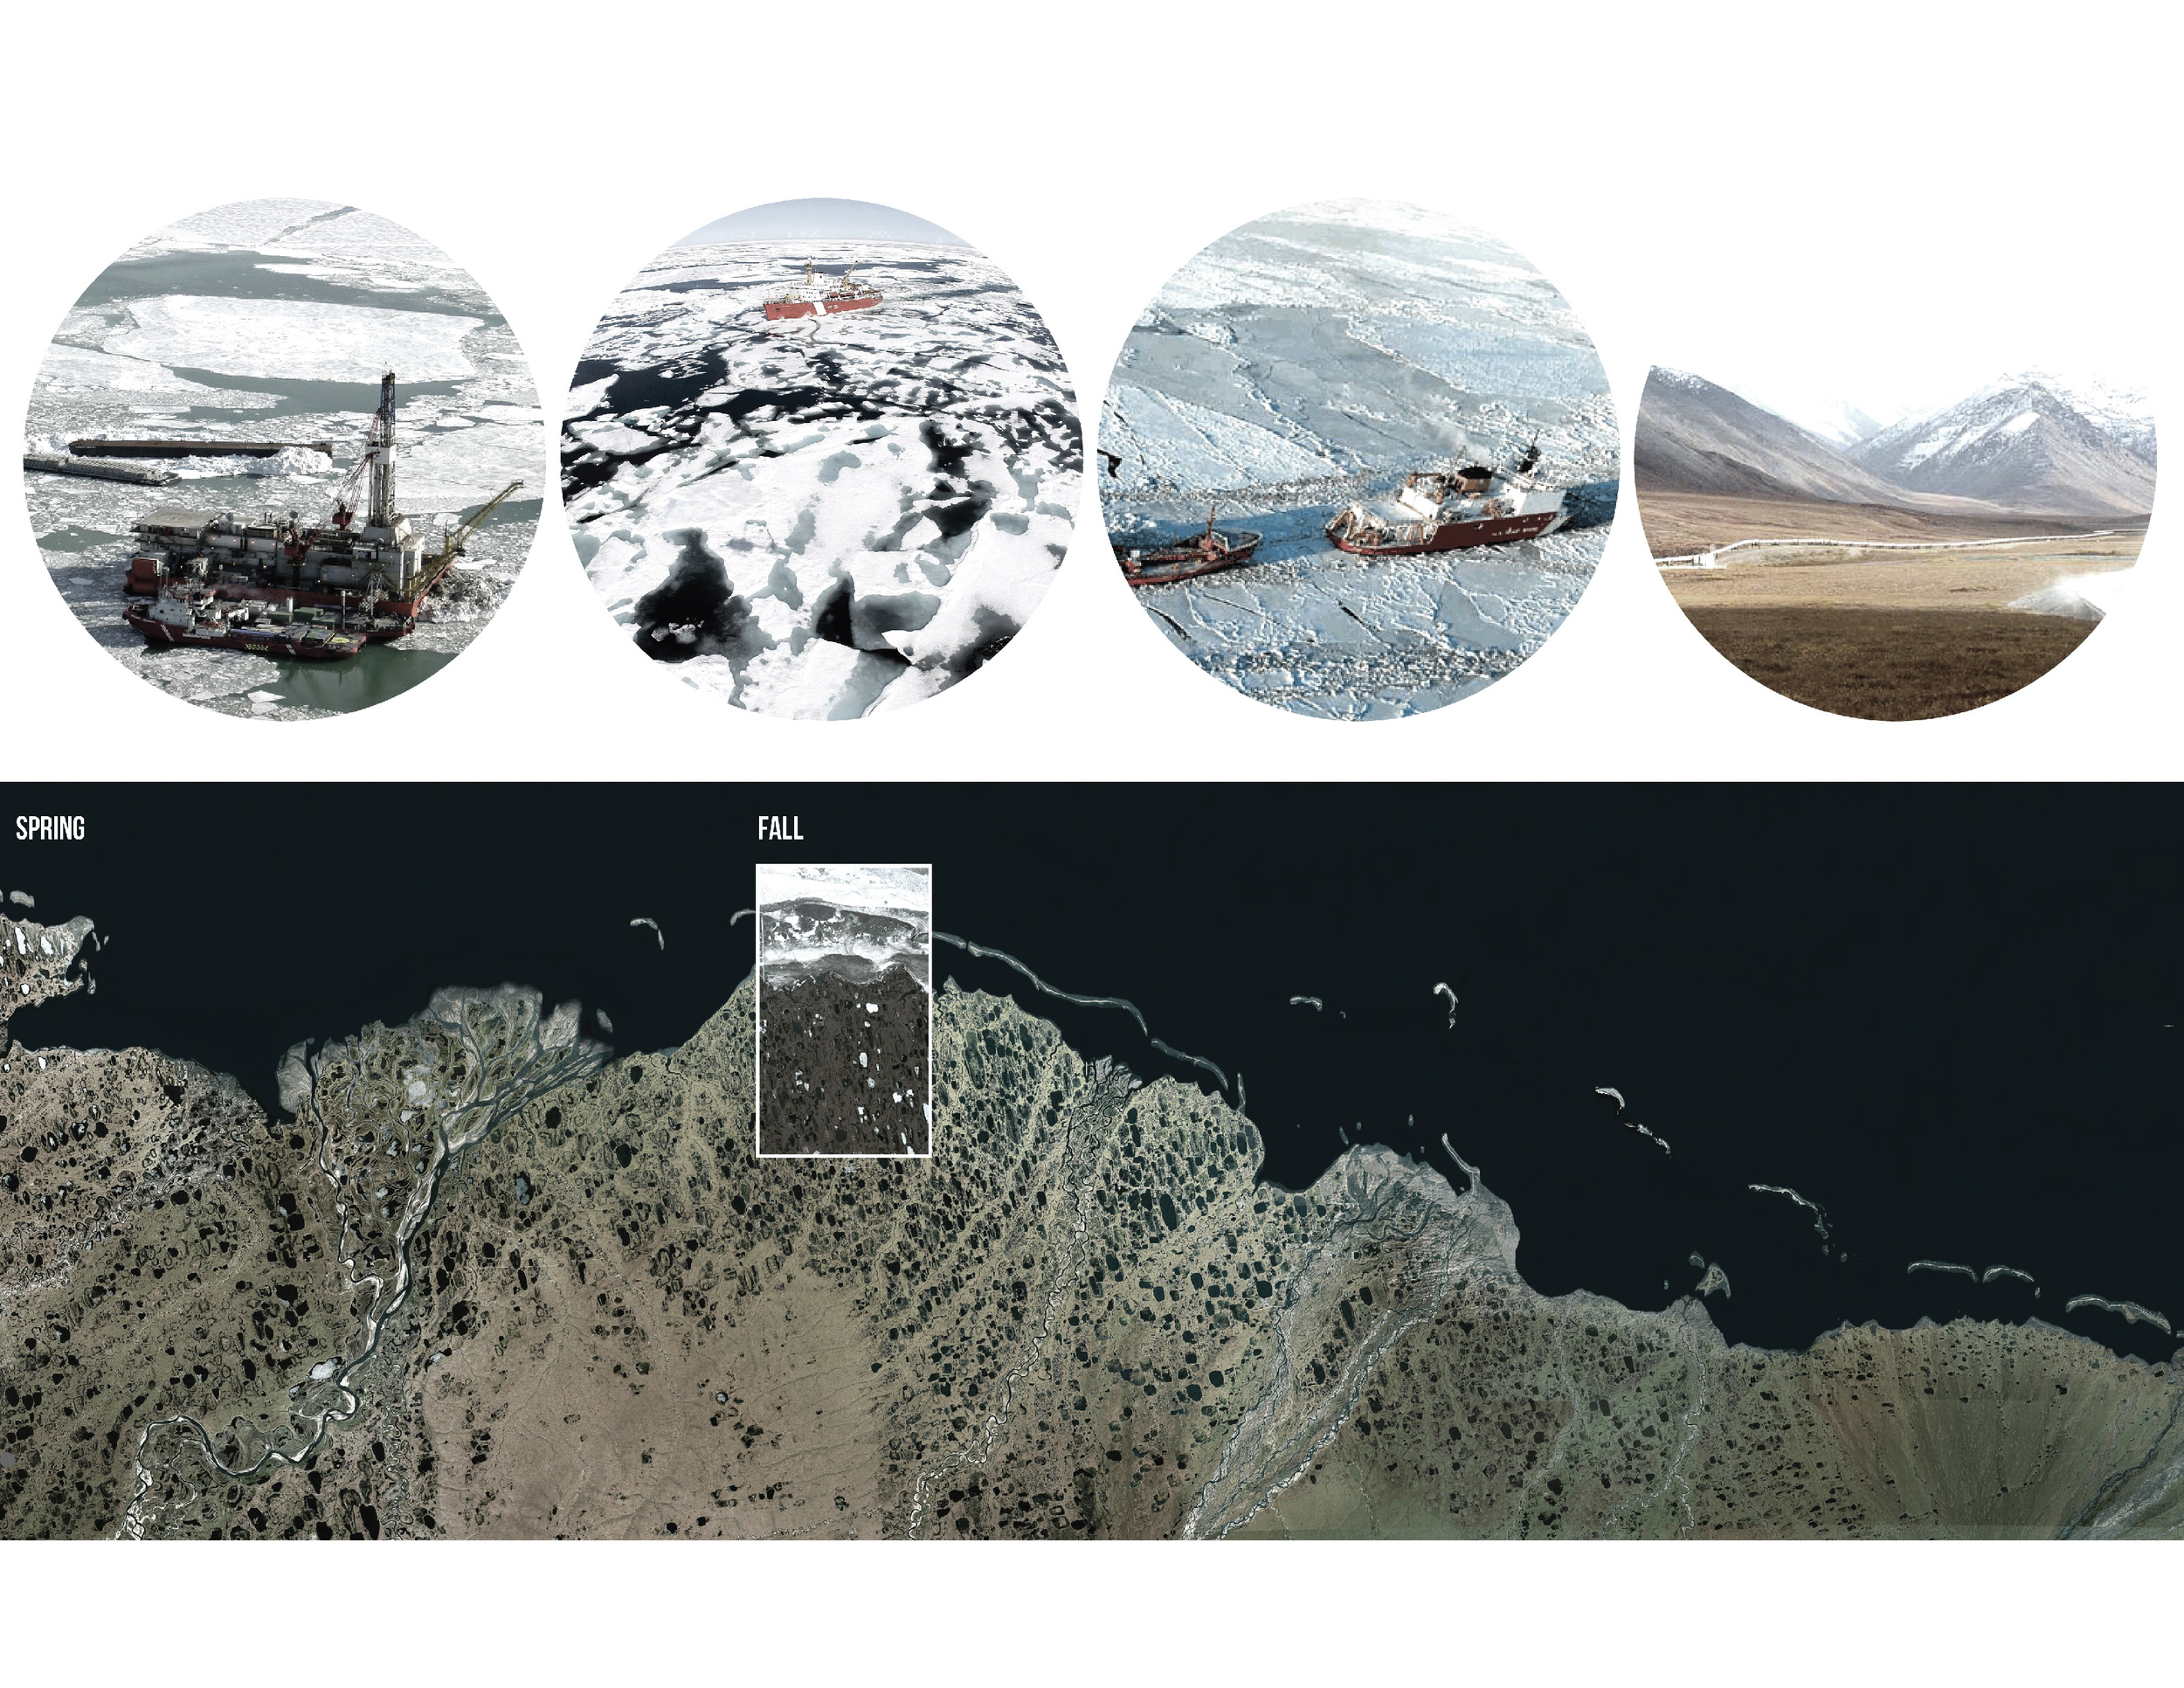
North Slope: Crude Frontiers
Oil extraction will take place here regardless of political and environmental pressures. The goal is to find a way to support the energy and economic needs when the oil stops flowing. We can leverage what is left of our hydrocarbons to support the next energy infrastructure and do it in a way that prevents the cyclical boom and bust cycle.
To investigate this, potential scenarios were developed to evaluate possible outcomes of intervening into the typical oil extraction process.
Alaska Oil Migration/ Construction Camps
This map illustrates the construction camps previously built along the pipeline to provide a base of operations for the workers. Today these stations are commonly abandoned. Here is an opportunity to couple infrastructure with program.

Scenario 1: Maximized Extraction
The first scenario evaluates the outcome of a scenario for maximum extraction on the North Slope. In this scenario offshore operations will proceed during the summer while avoiding critical ecological zones. During off peak hours workers will deploy along the pipeline camps and repair the infrastructure before building new oil and gas pipelines adjacent to the Trans-Alaska infrastructure connecting to the lower 48 states. This is the scenario that is a likely option given the past process in Alaska.
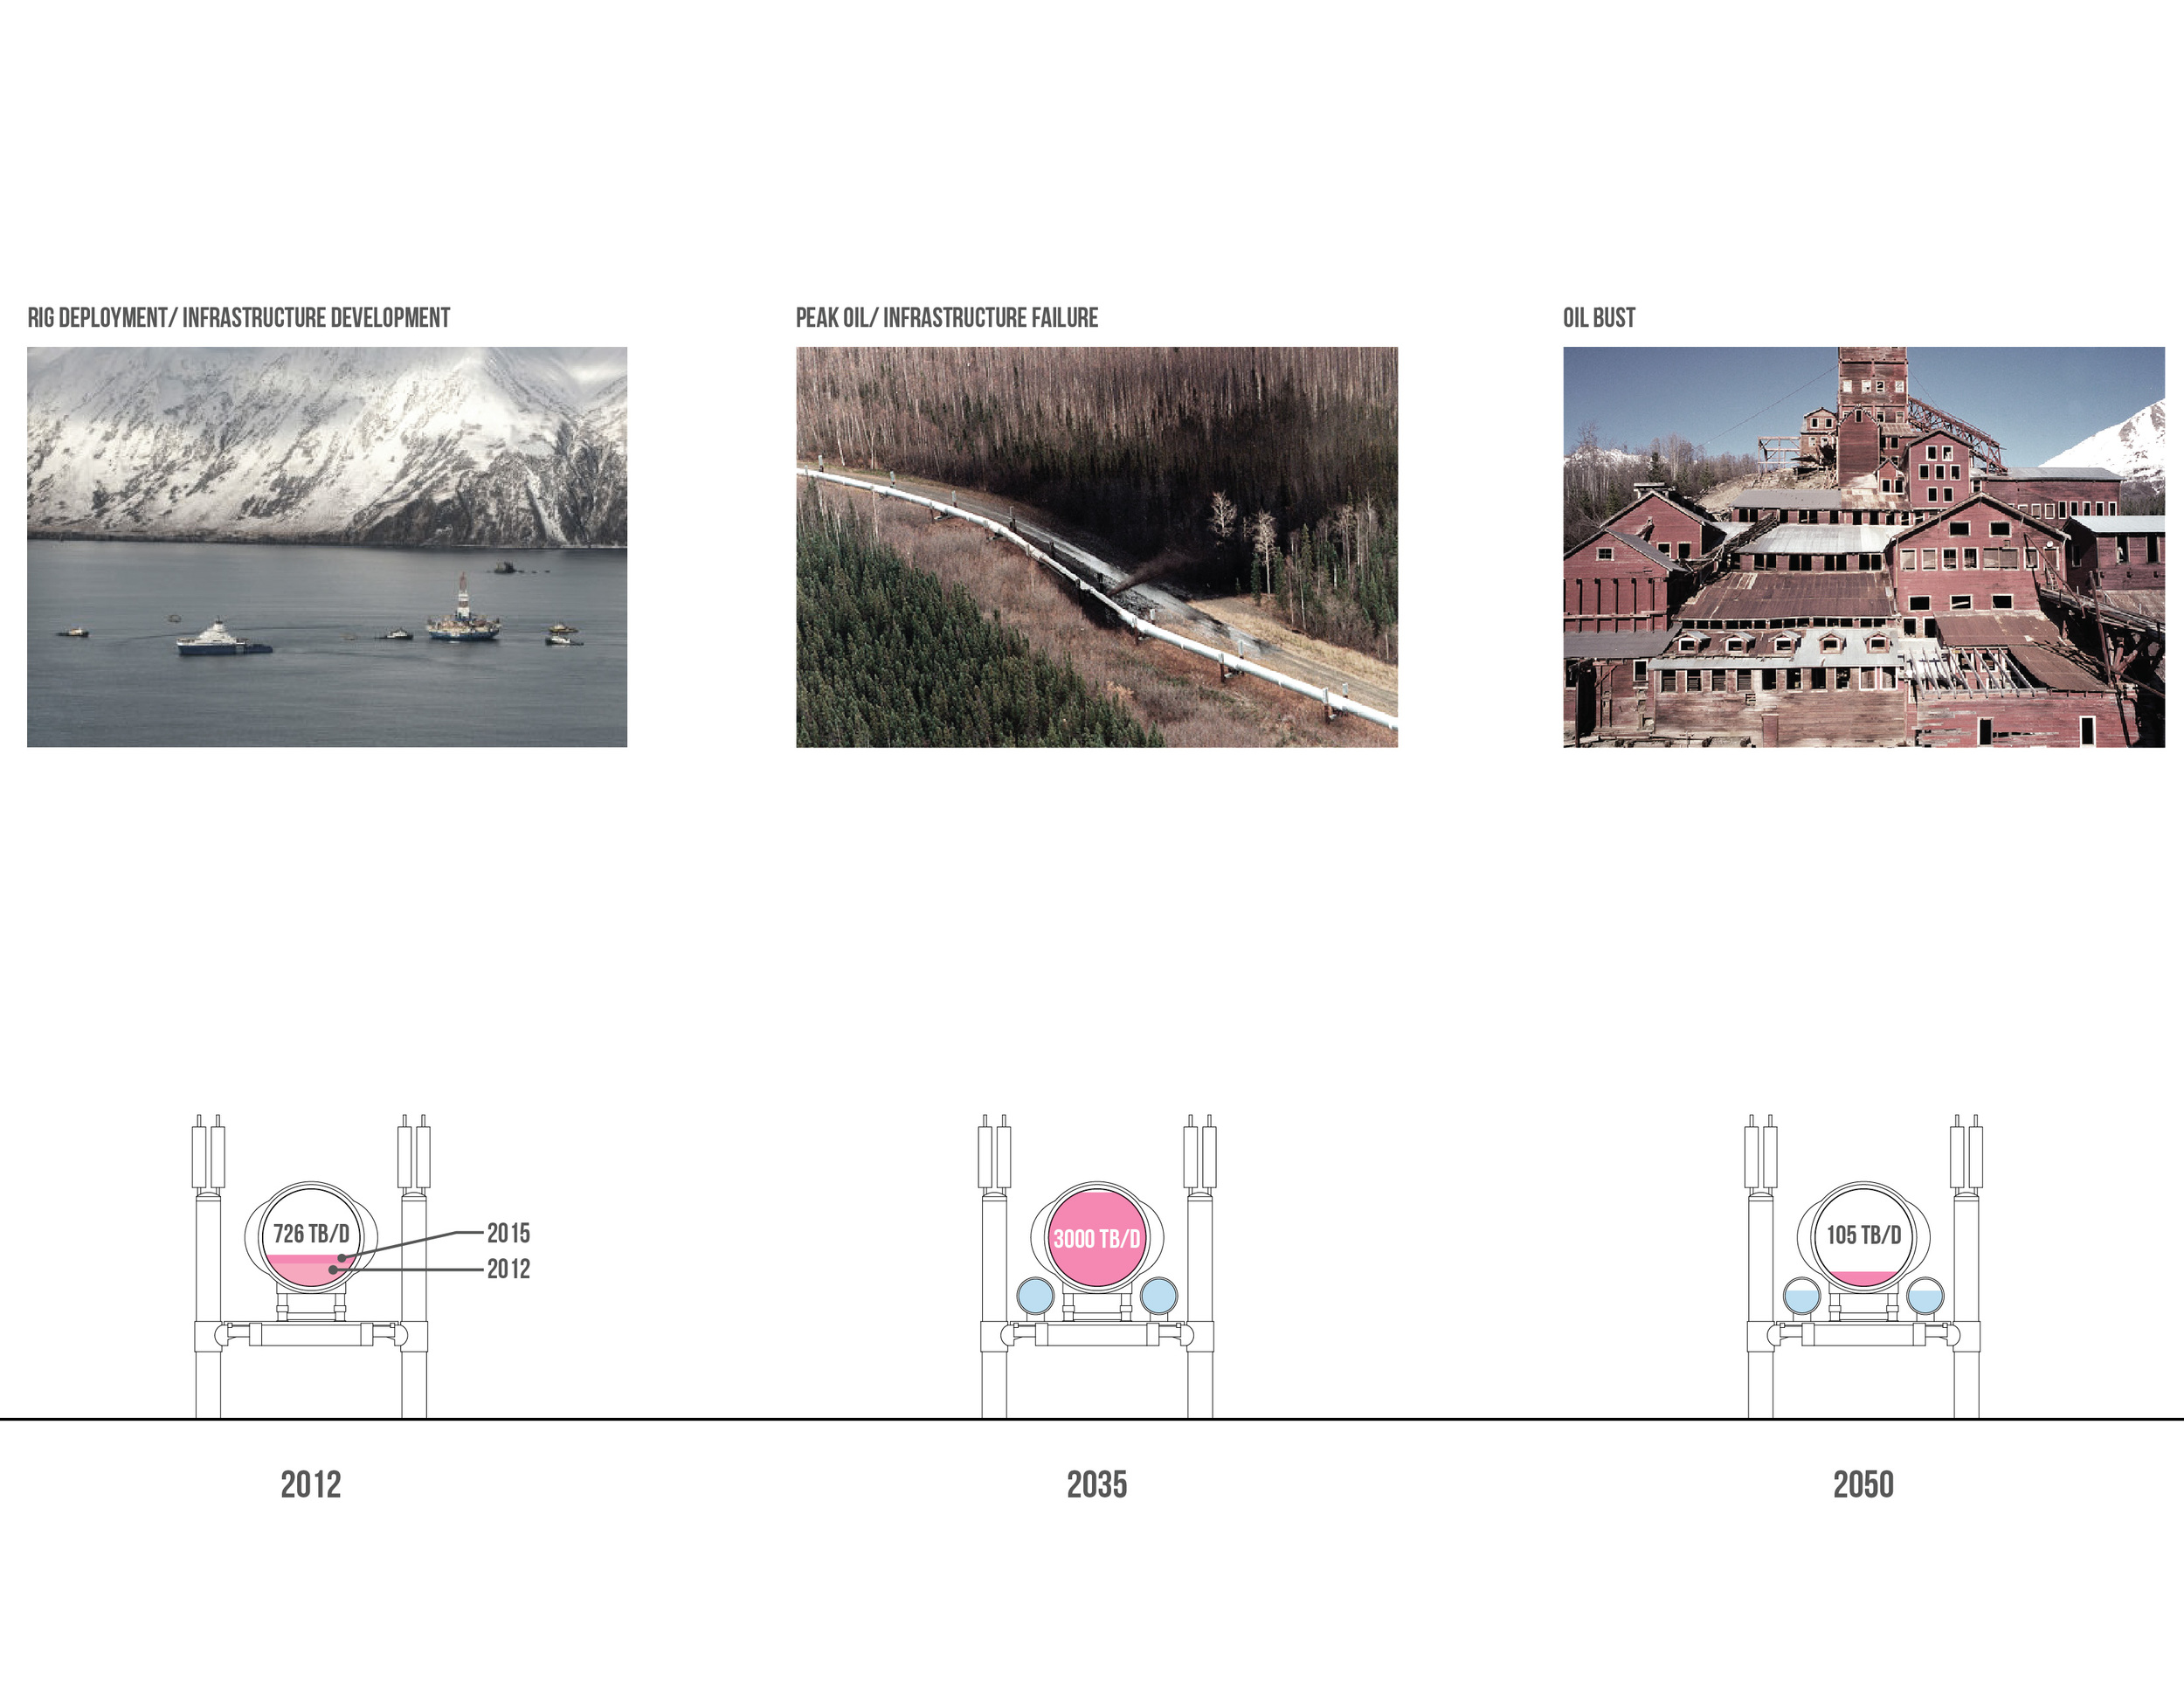
Alaska’s Recurring Boom Bust Cycle
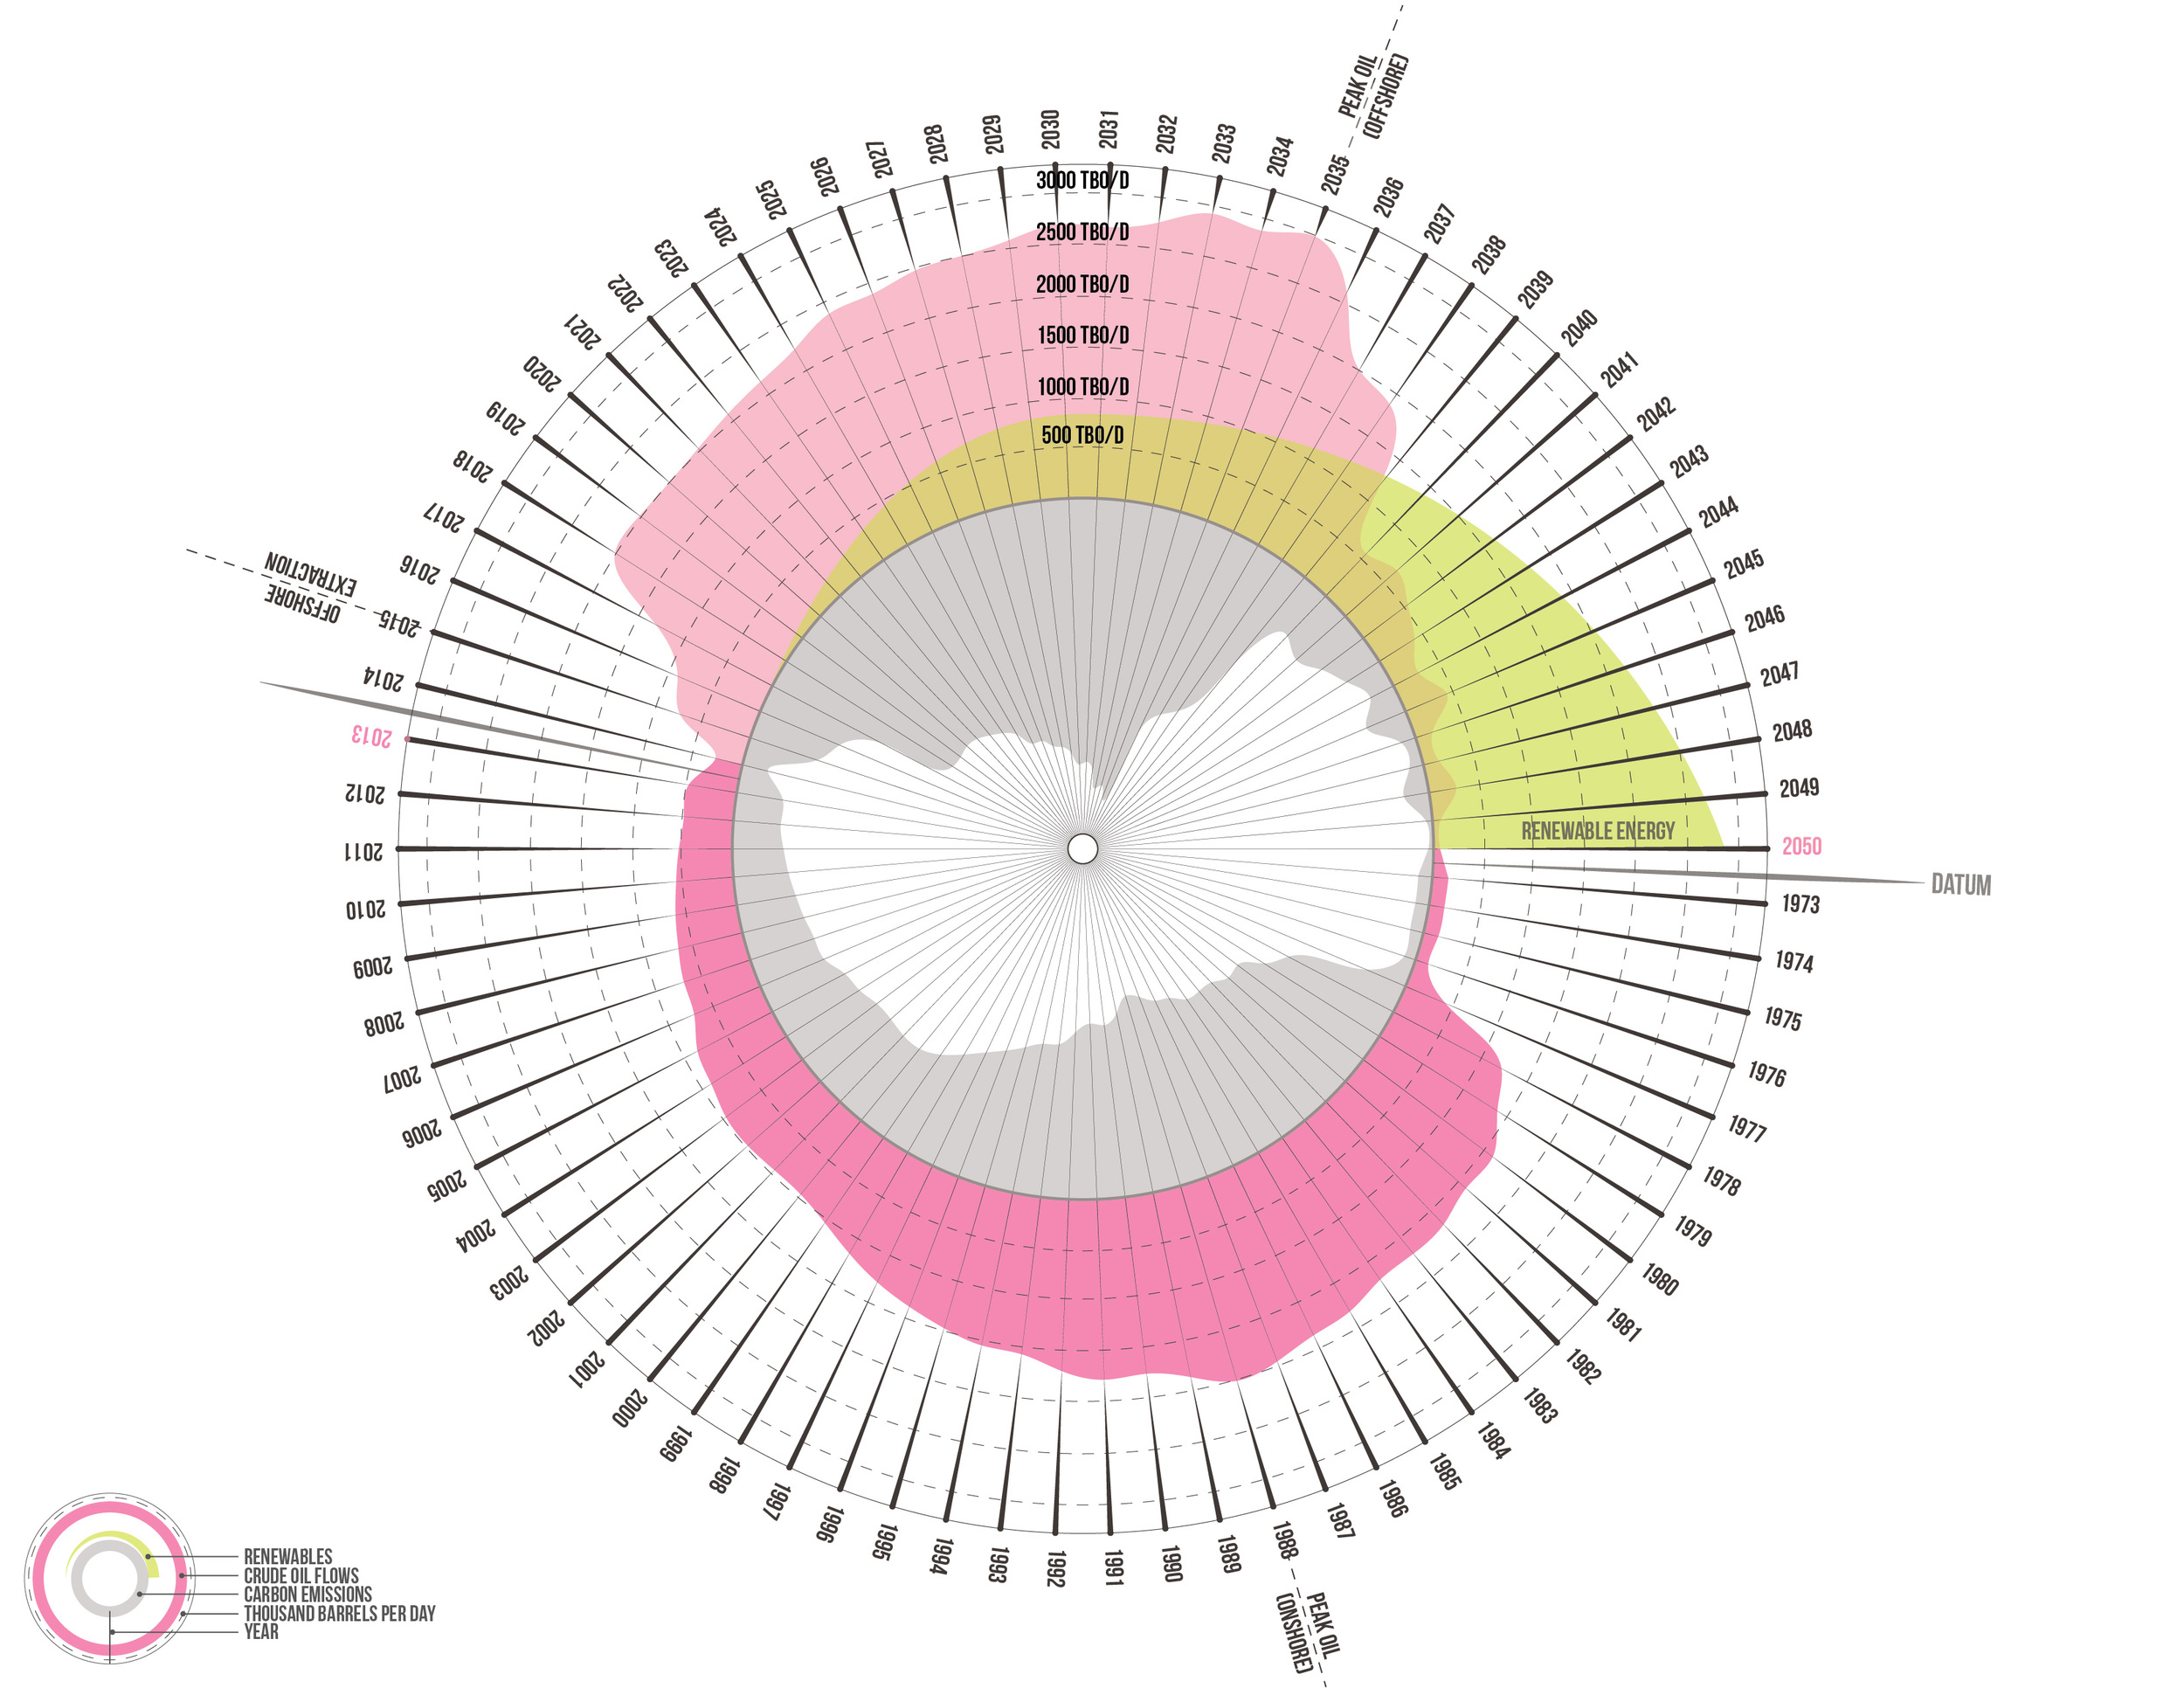
Over the next 30 years the oil that flows through the pipeline will rise to approximately 3000 trillion barrels of oil per day. With no industry available to support facilities and infrastructures built during the oil boom the oil hubs with turn into ghost towns and the states wealth will significantly decline.
Scenario 2: Ecological Economy
Tourism remains a large attractor and a significant part of the Alaskan economy. The tourism industry brings in around 850,000 visitors annually. The expansion of arctic drilling will provide a new tourism market. Today the tourism provides “over 36,000 direct and indirect jobs and accounts for 8 percent of Alaska’s employment”. Currently Alaska has the United States second largest outdoor sporting industry. Primarily during the spring and summer months tourist come to Hunt, fish, hike, bird watch, raft, ski, camp and dog sled.
An alternative scenario to the typical extraction process is to promote an ecological economy that can be seeded during the off peak oil extraction and thrive after the oil extraction process finishes.
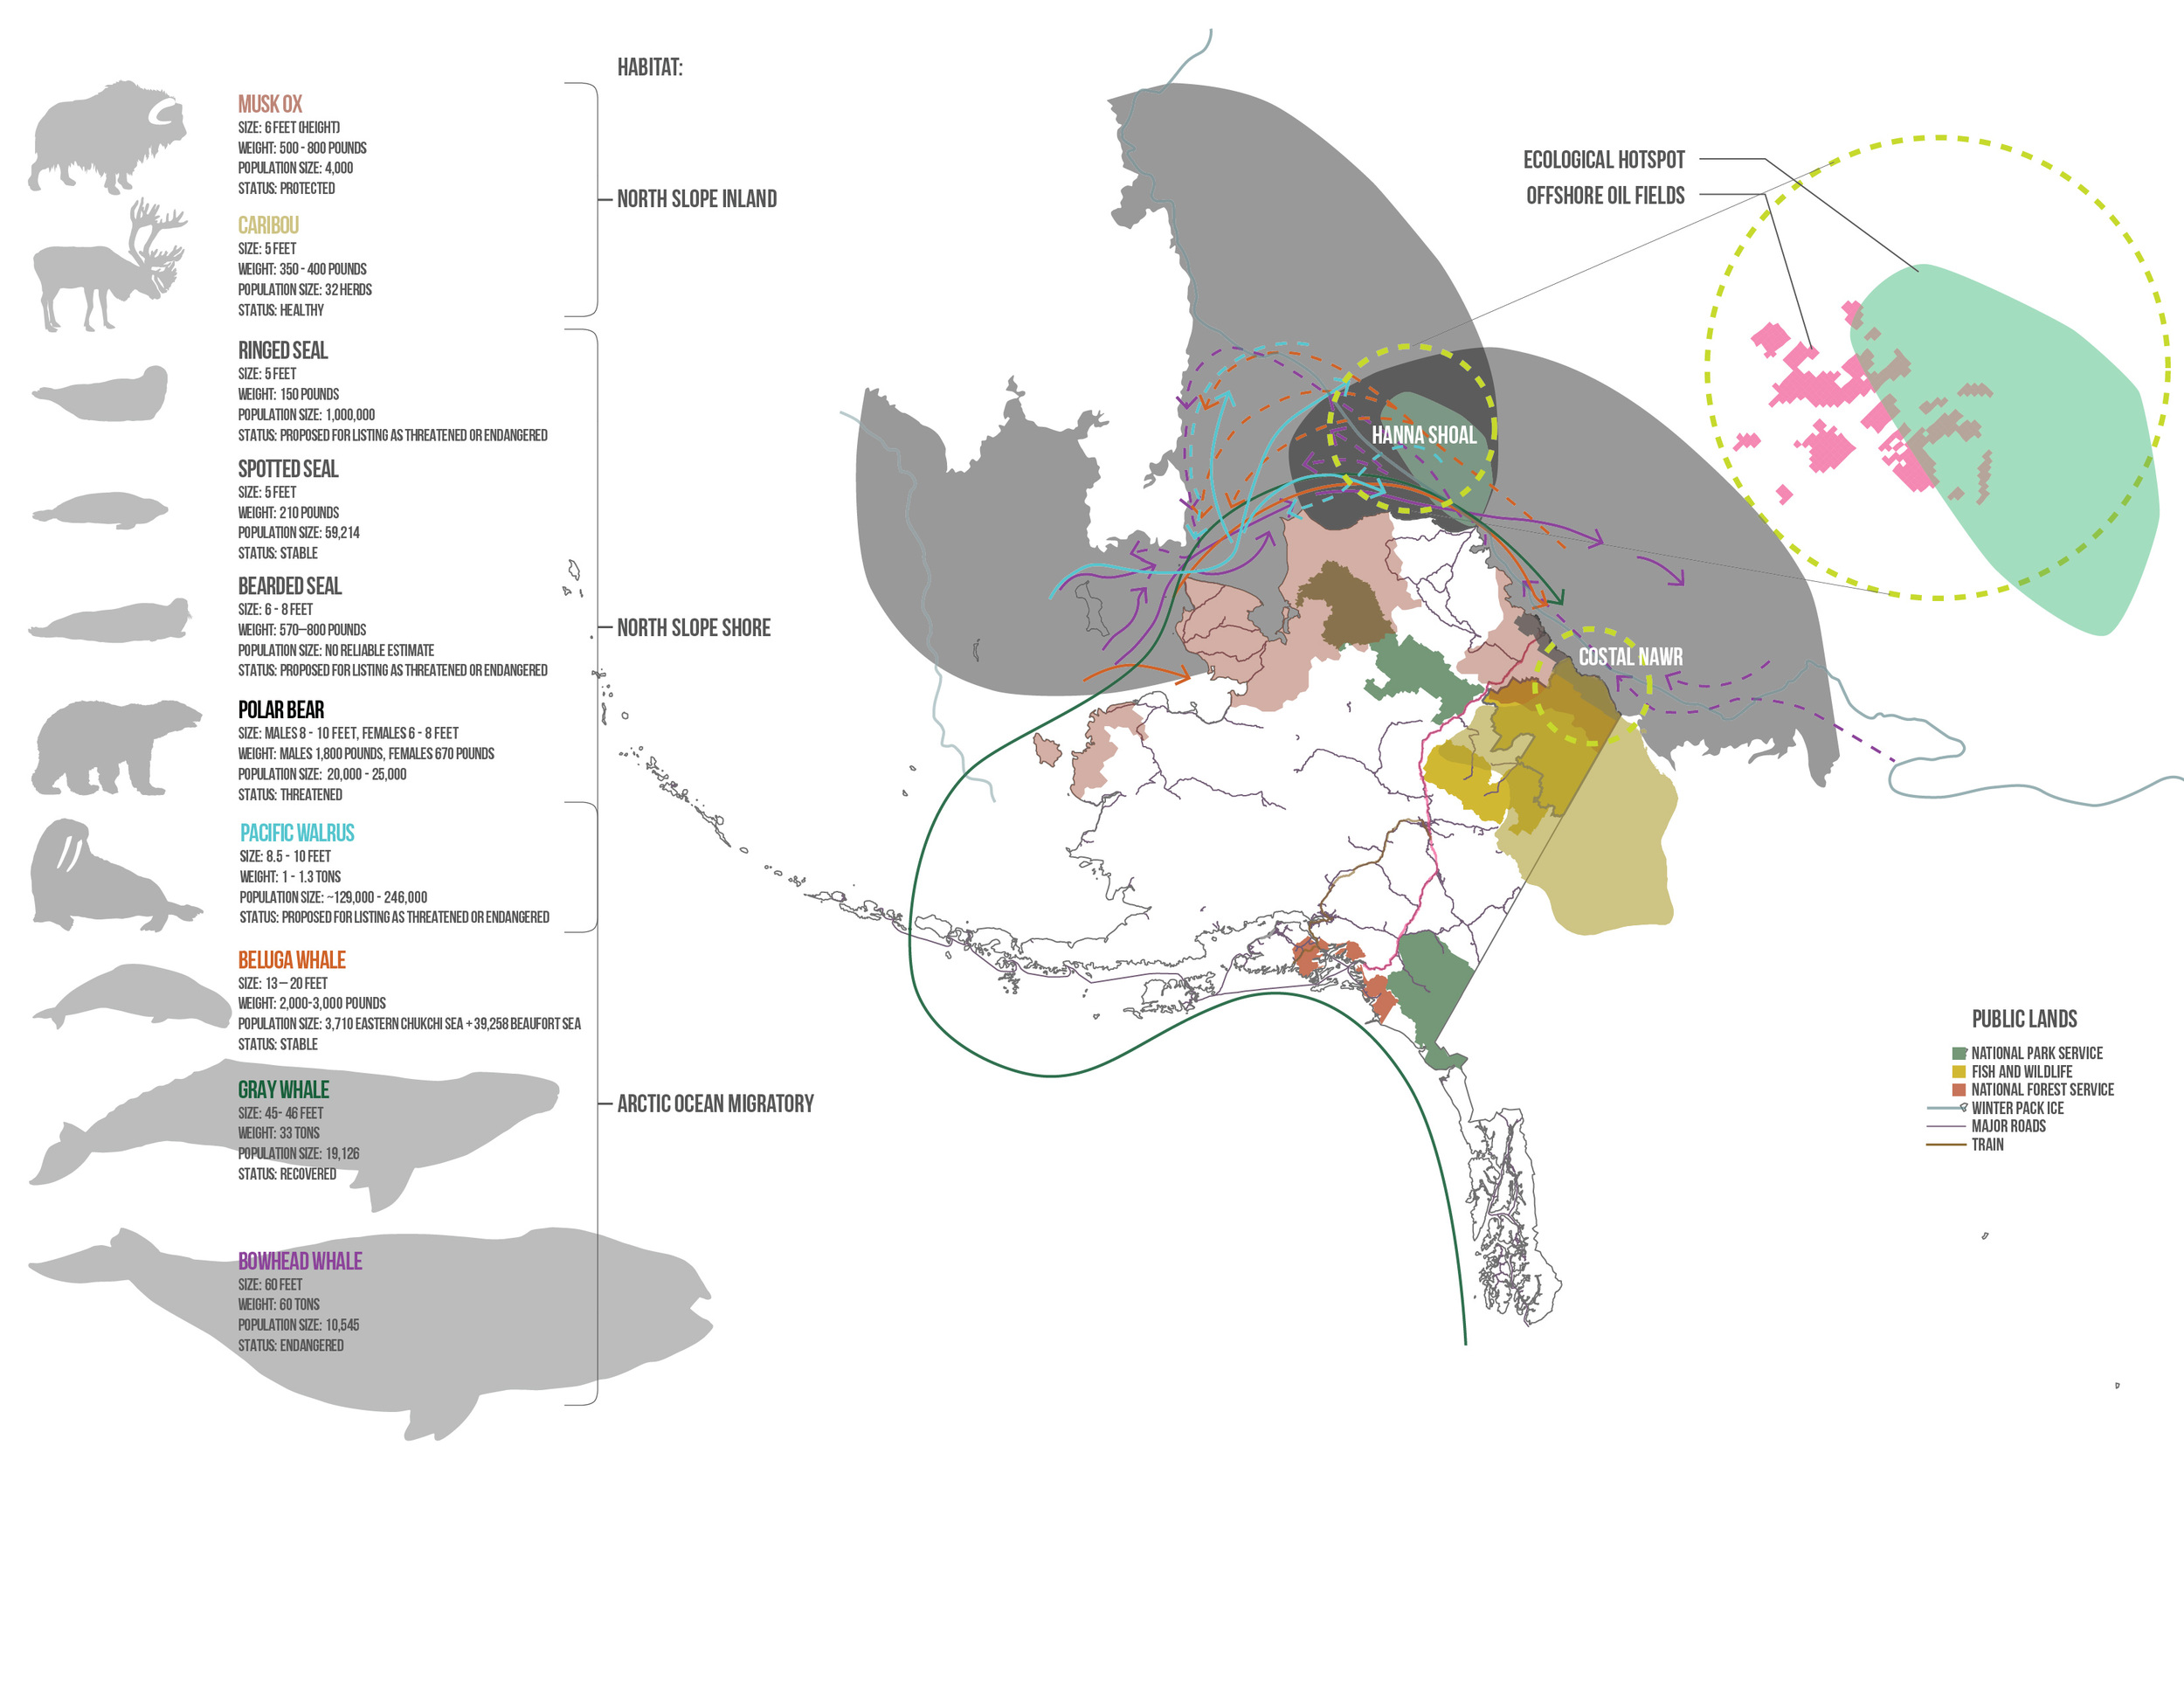
Energy/ Environment Schism
Because of the geophysical footprint necessary to support infrastructure demands and the encroachment on federal lands and protected areas, habitat loss is inevitable both onshore and offshore.
At the heart of one of Alaska’s significant hydrocarbon sites in the Chukchi Sea is Hana Shoal. This sensitive marine environment is host to millions of marine organisms including snow crabs, clams and fish. Many large mammals also live off the northern coast of Alaska include the seal, walrus’s and many species of whales. The bowhead whale is an important part of the native Alaskan heritage. Every fall the local residents hunt and harvest the whales for resources critical to maintaining the way traditional way of life. The meat is divided among the residents and consumed through the winter and the oil is used for energy.
Reestablishing the pipeline camps as tourism hubs will encourage economic growth and give additional agency to the Arctic National Wildlife Refuge (ANWR). Establishing hubs adjacent to ANWR will help protect crude oil extraction from mutilating the protected land and prevent habitat loss along the arctic shoreline.
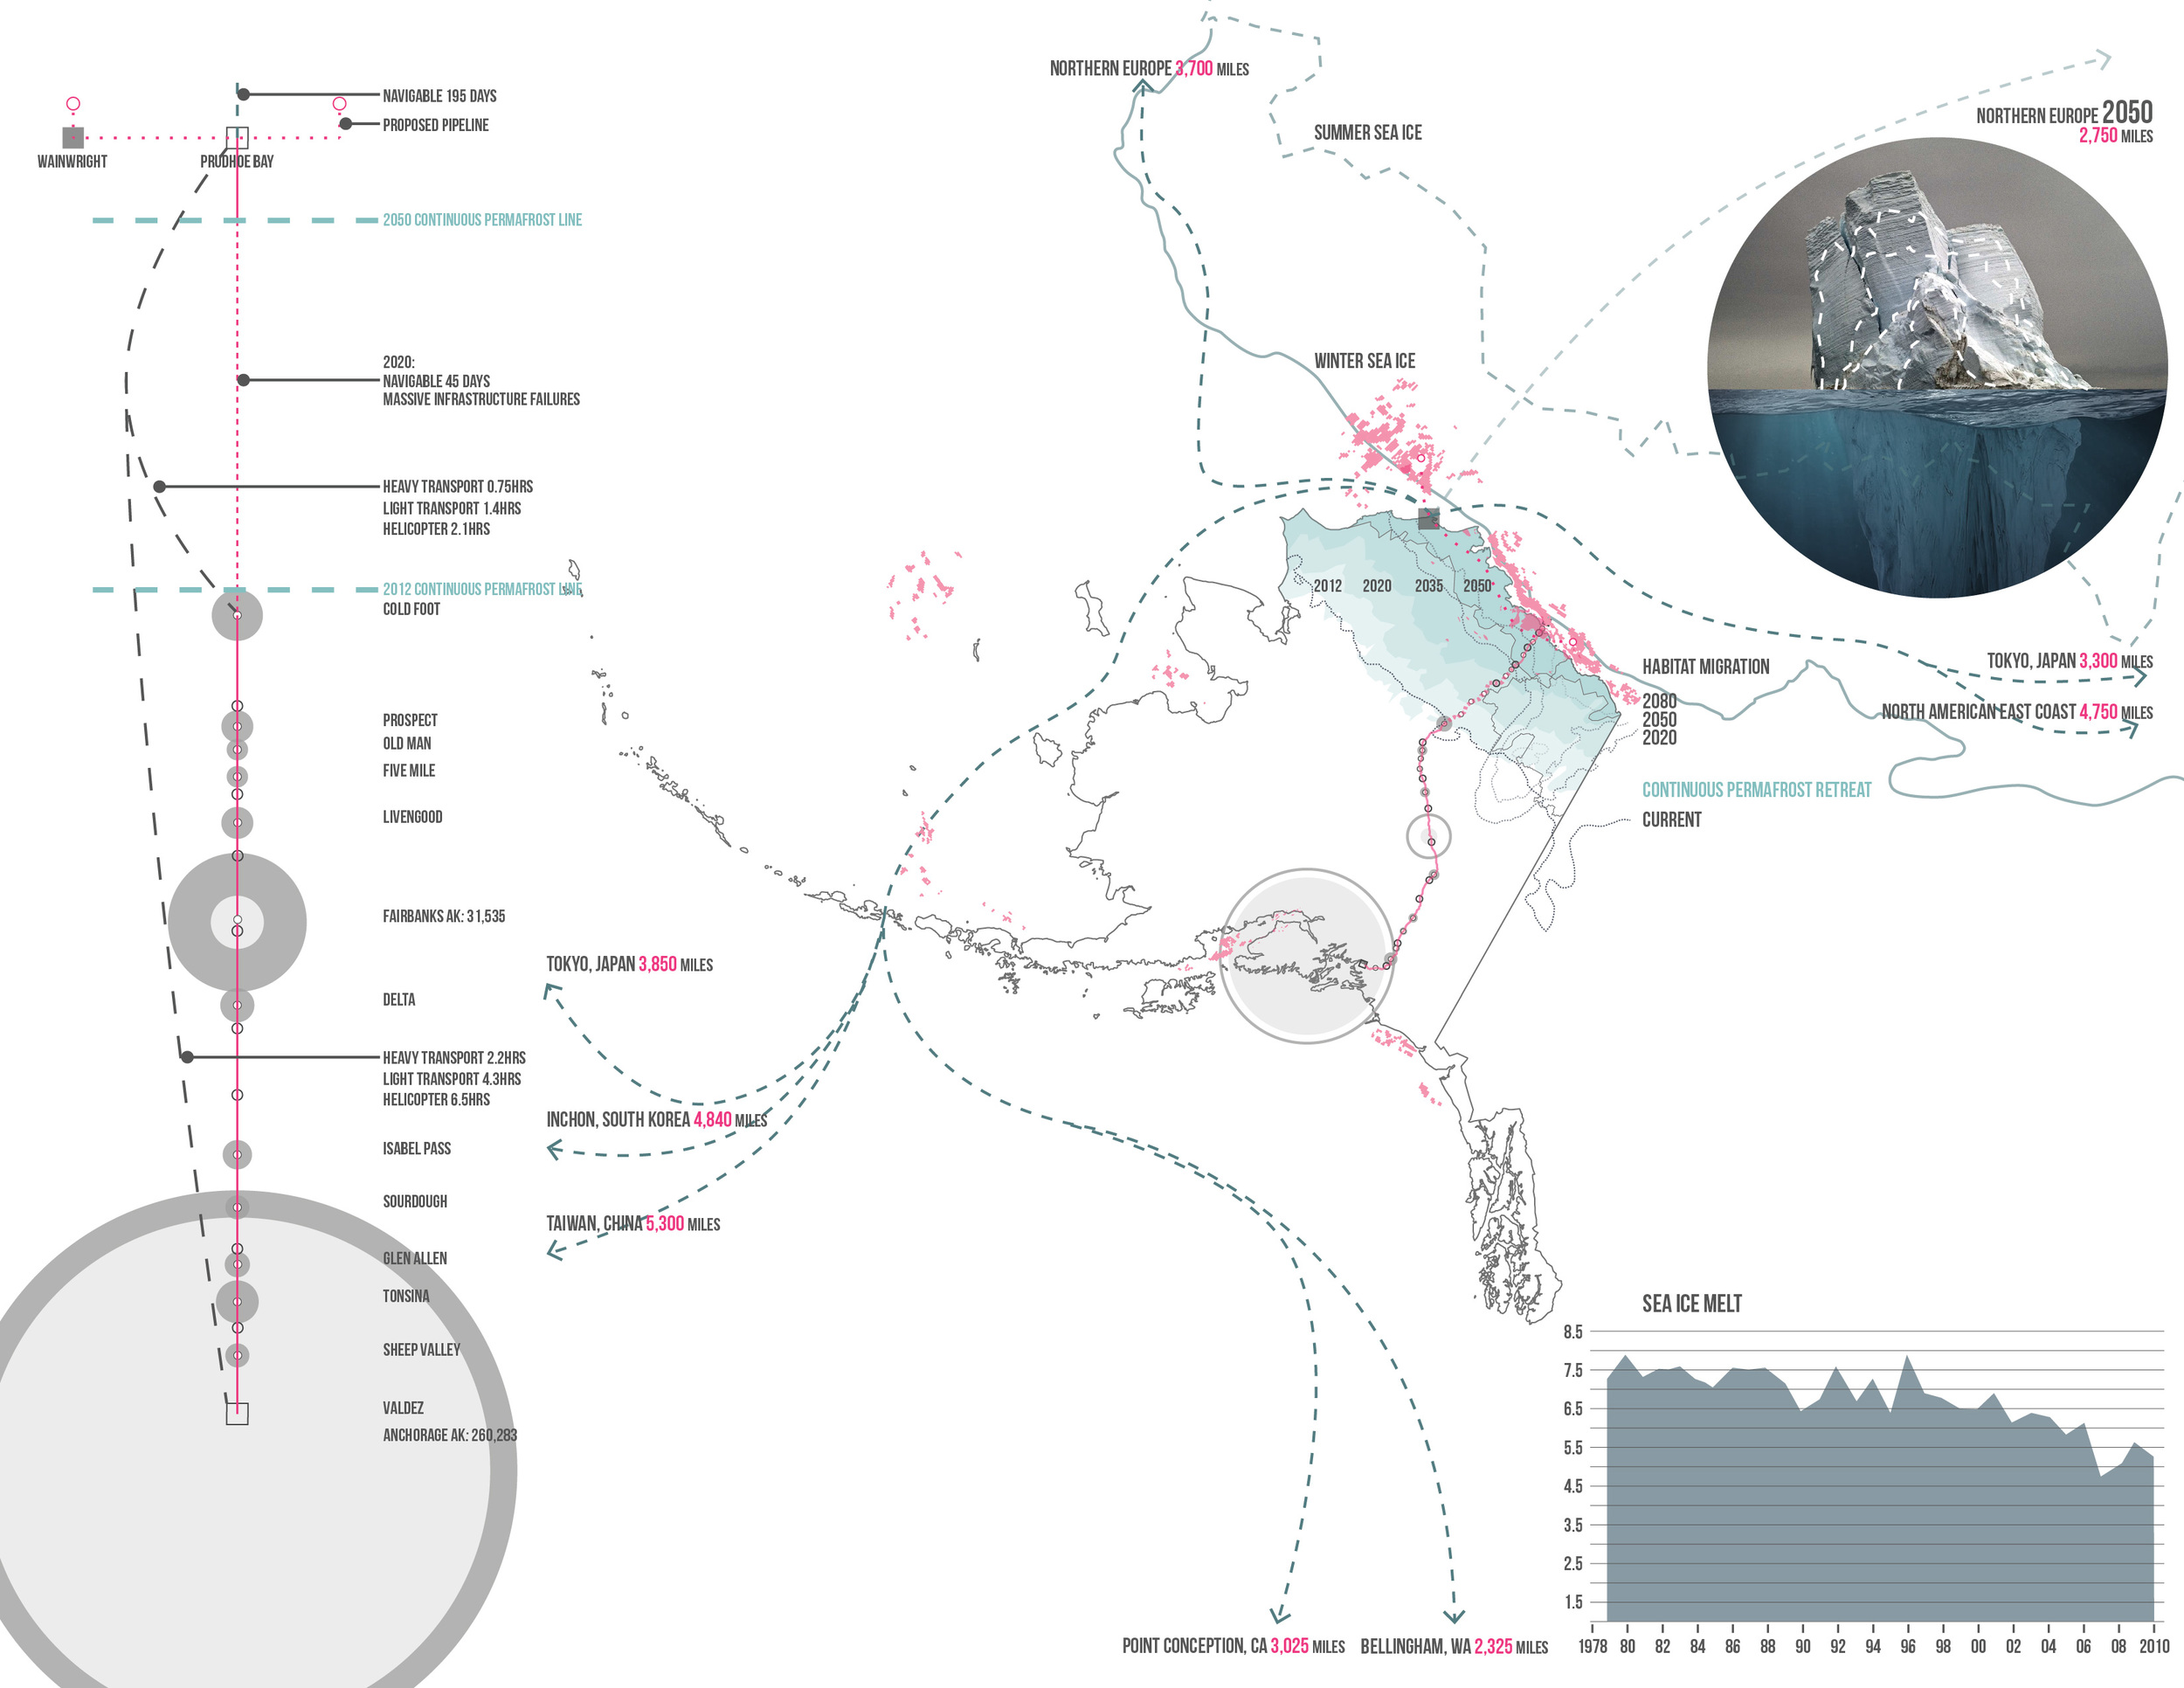
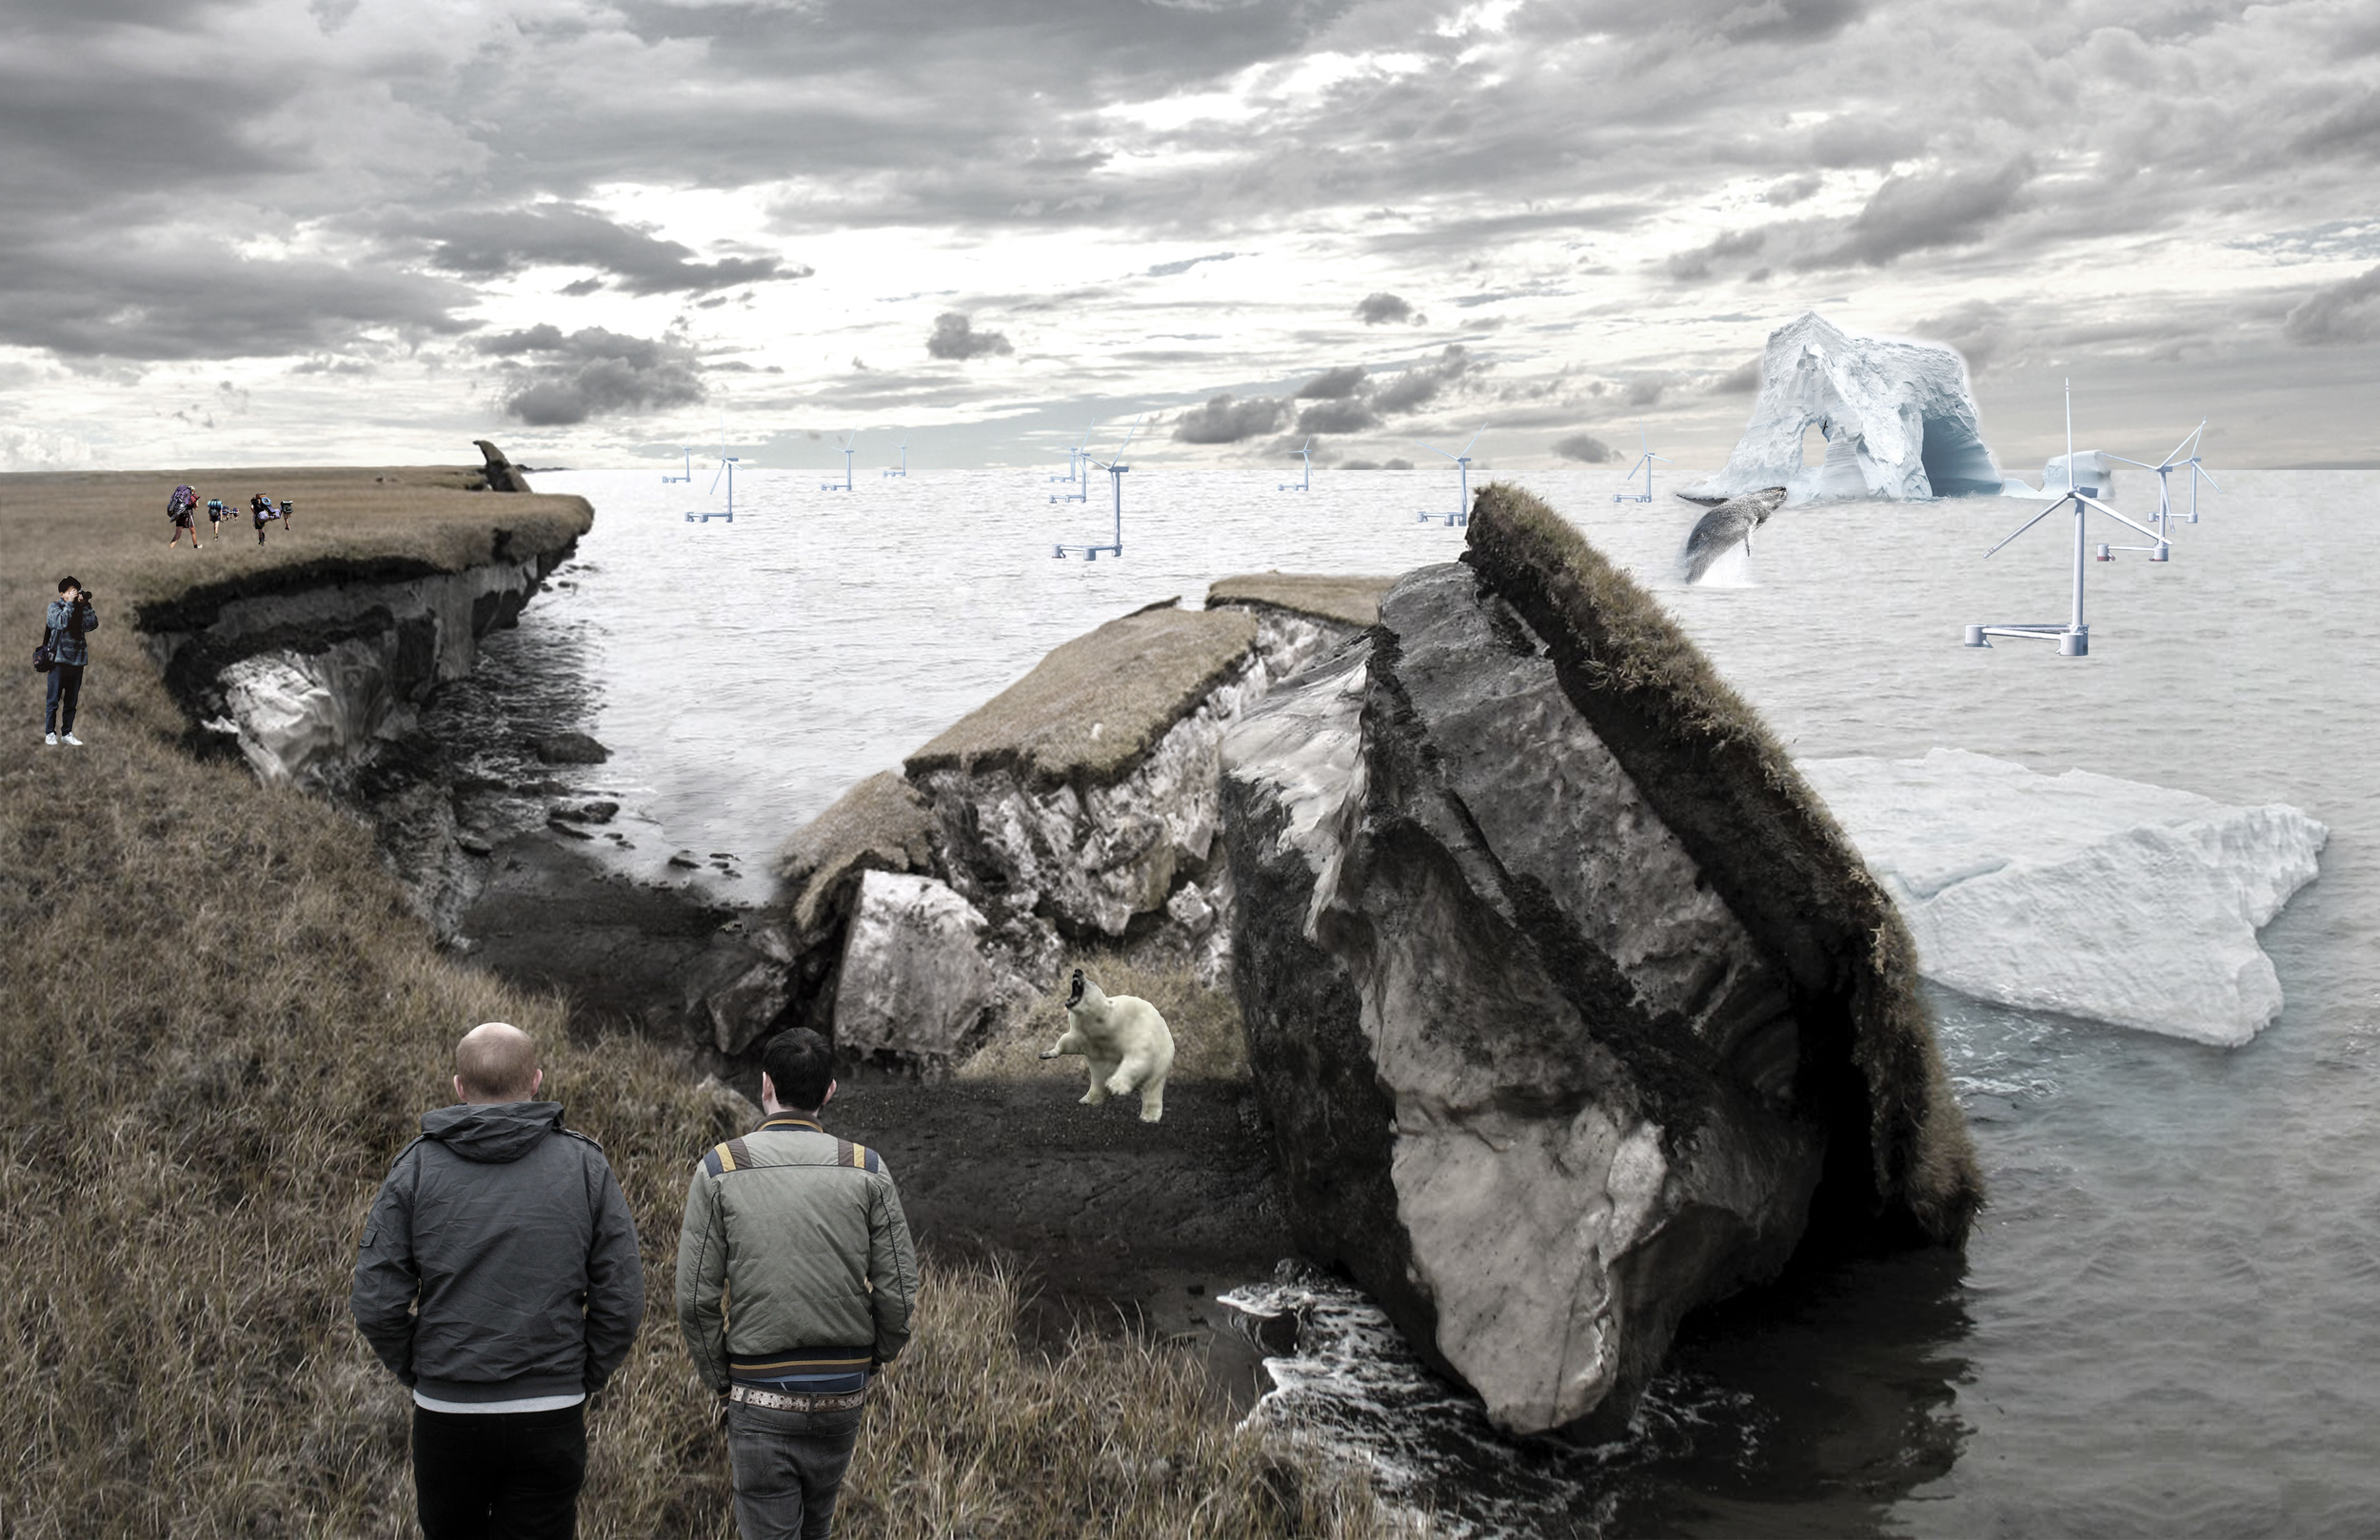
Scenario 3: Extreme Climate Change
Another scenario to consider is the possibility of extreme climate change and what effect that will have on hydrocarbon extraction and the migration of the North Slope’s ecology. As global continues to thaw the artic, waterways we become navigable, allowing oil to transport to global markets quicker and cheaper.
Scientist are predicting that the Alaskan permafrost will retreat hundreds of miles north by 2050. This will open ground in southern and central Alaska. Because of the low cost of living here and the availability of natural resources. If the trans-Alaska pipeline armature incentivizes development through installation of basic services then significant population increases could develop.
![The [Re]Active Layer](https://images.squarespace-cdn.com/content/v1/5435add3e4b00a9987e4bdca/1438559434440-E79LU5GG478QQYOYGY2W/image-asset.jpeg)
The [Re]Active Layer
Alaska’s active layer (transient ground hardness) will continue to defrost until the permafrost ponds remain thawed year-round. The ground around the ponds and lakes will become soft and unstable. How will arctic infrastructure respond to the future unstable ground?
A Sustainable Scenario
To become resilient to a post-peak oil bust Alaska needs to respond to and employ elements of all three scenarios. If Alaska were to impregnate the vacant base camps along the Trans-Alaska pipeline with program that supports the oil industry, future energy sources and its underserved ecological economy. Coupling this single use infrastructure with alternative program provides the bones for establishing an economy that will cohabitate the infrastructure for recreational needs.
Coupling the energy infrastructure with renewable energy resources will ensure that future energy and state economical demands are met after peak oil. Alaska has vast renewable energy potential that, if harnessed, will succeed the hydrocarbon industry. Because of the limited offshore extraction season the workers can operate for half of the year. During this other half of the year the oil workers can find employment supporting the alternative energy industries.
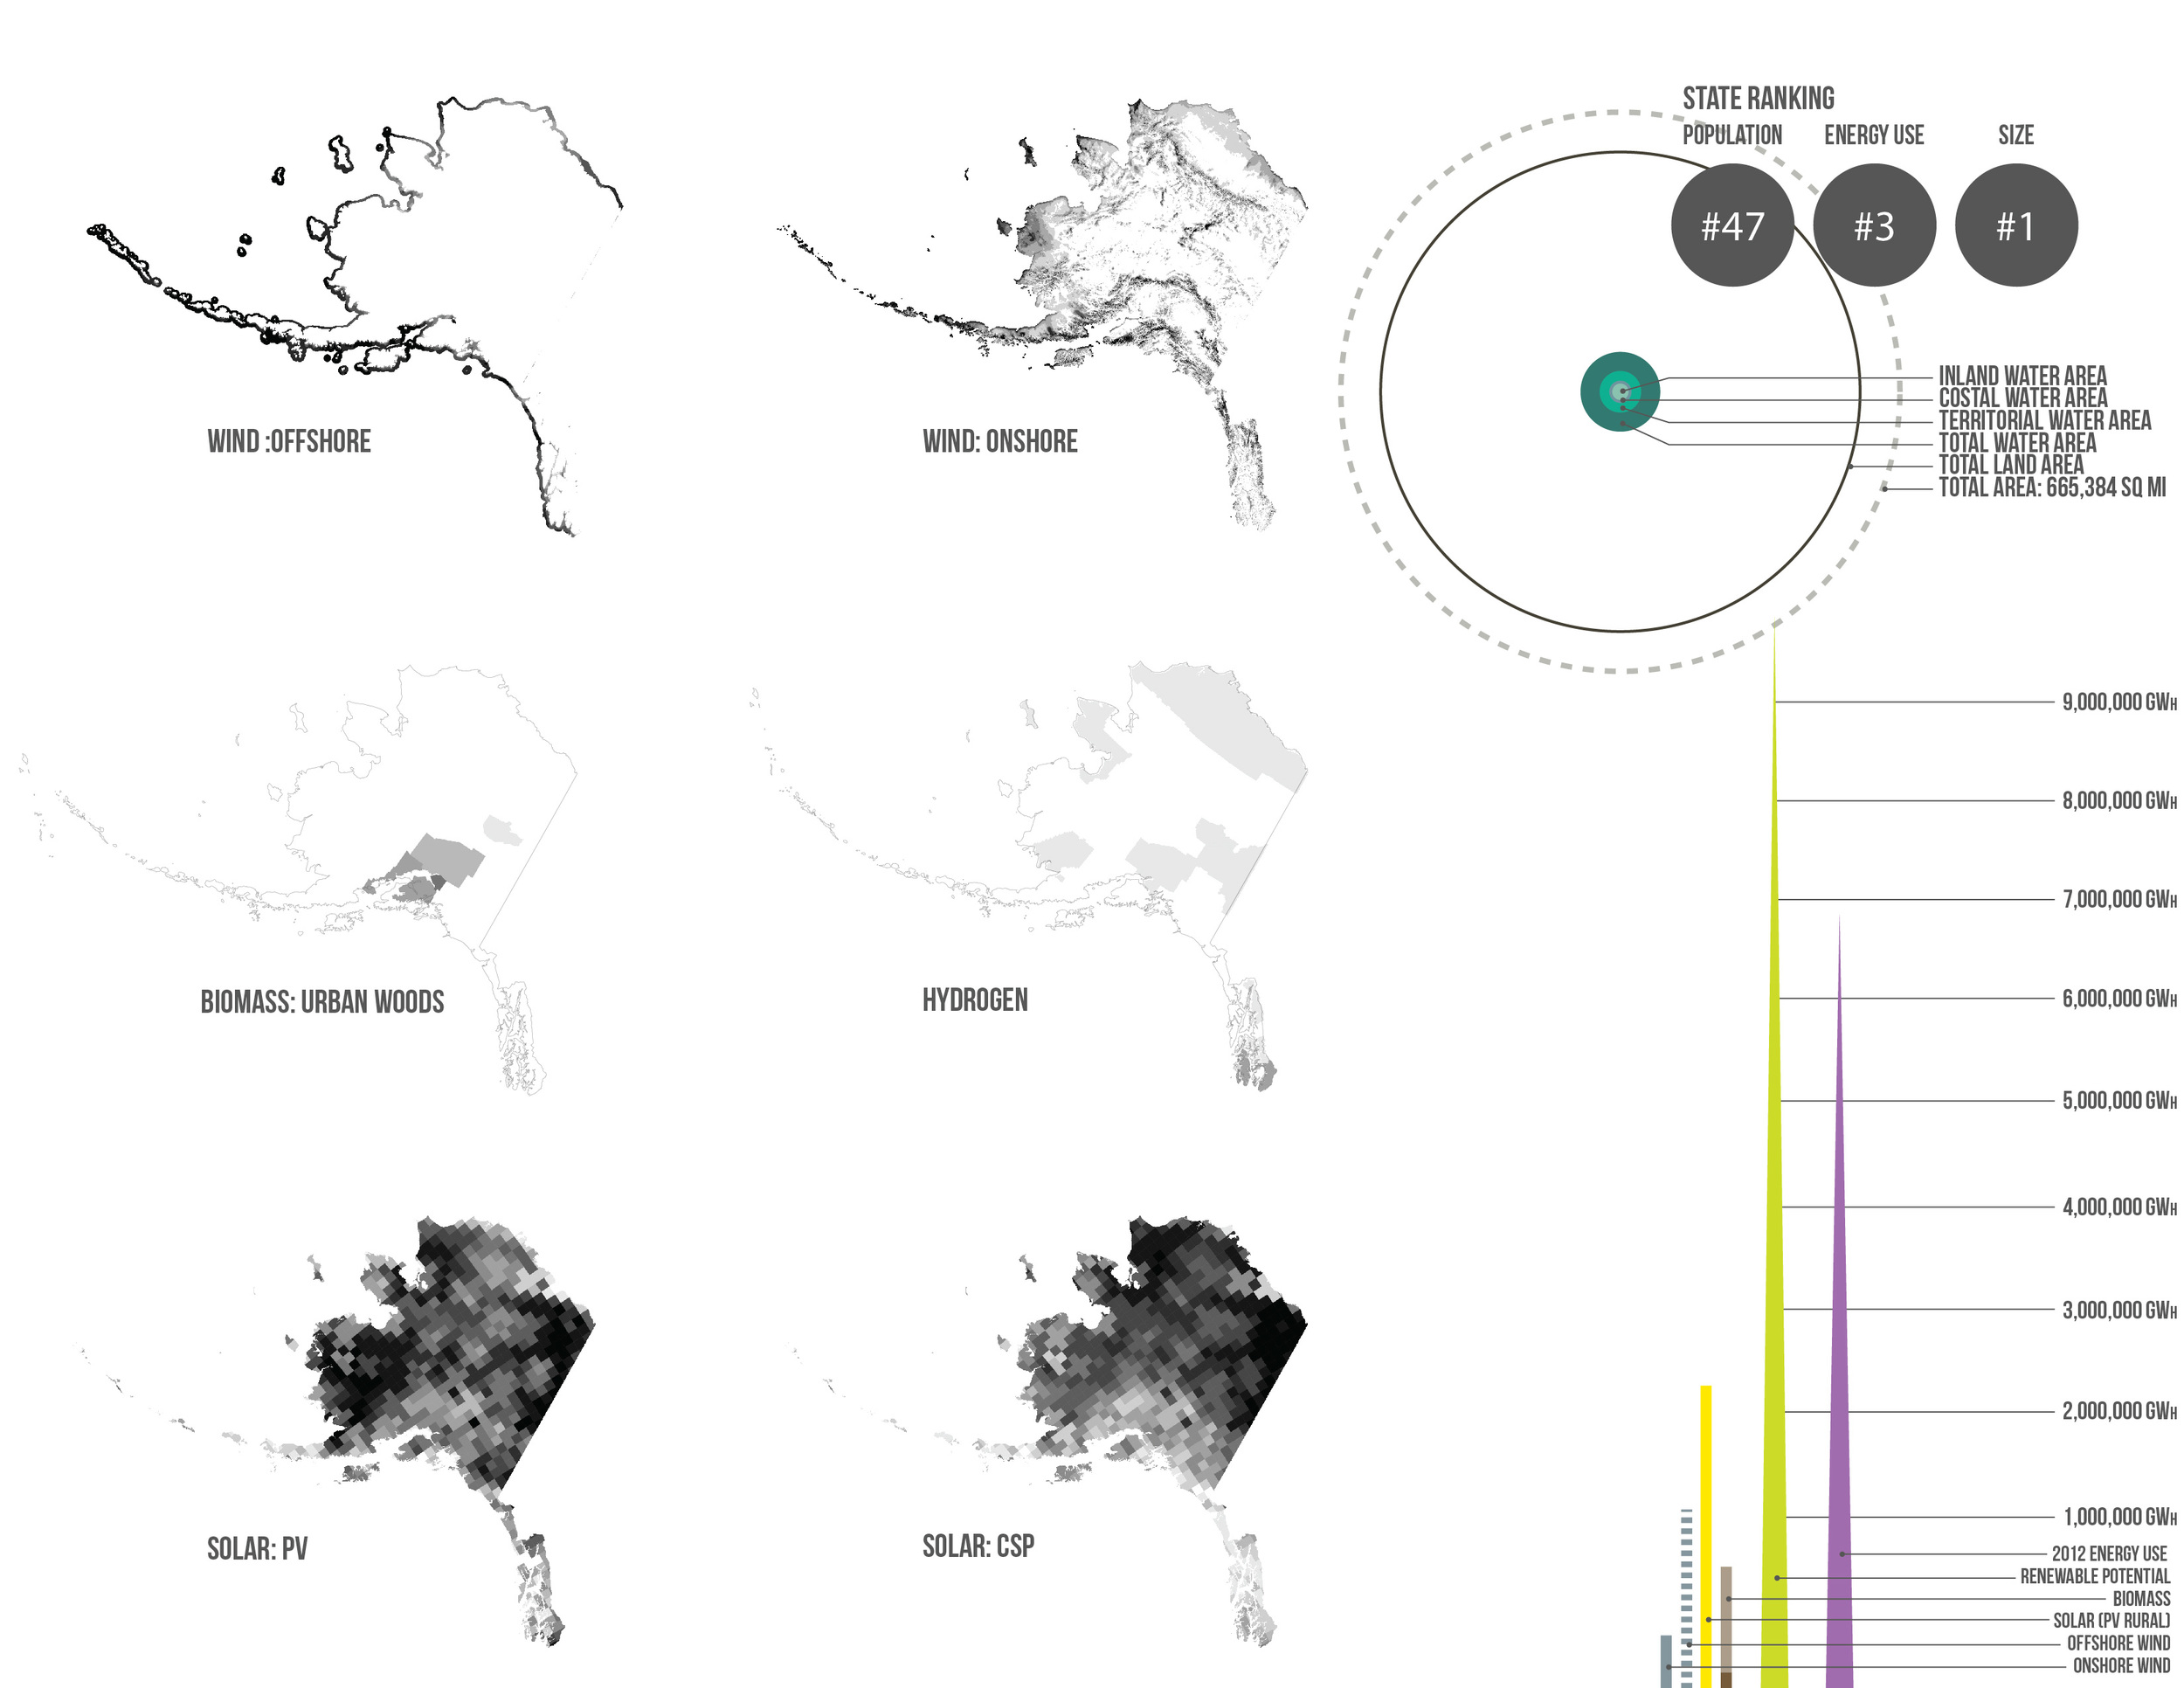
Alaska’s Energy Potential
Alaska has enough renewable energy resources to displace the state’s current fossil fuel consumption volume. Solar, biomass and wind energy have the most potential for energy production. Because of the state’s large land area and small population, the potential for large scale renewable farming is enormous.
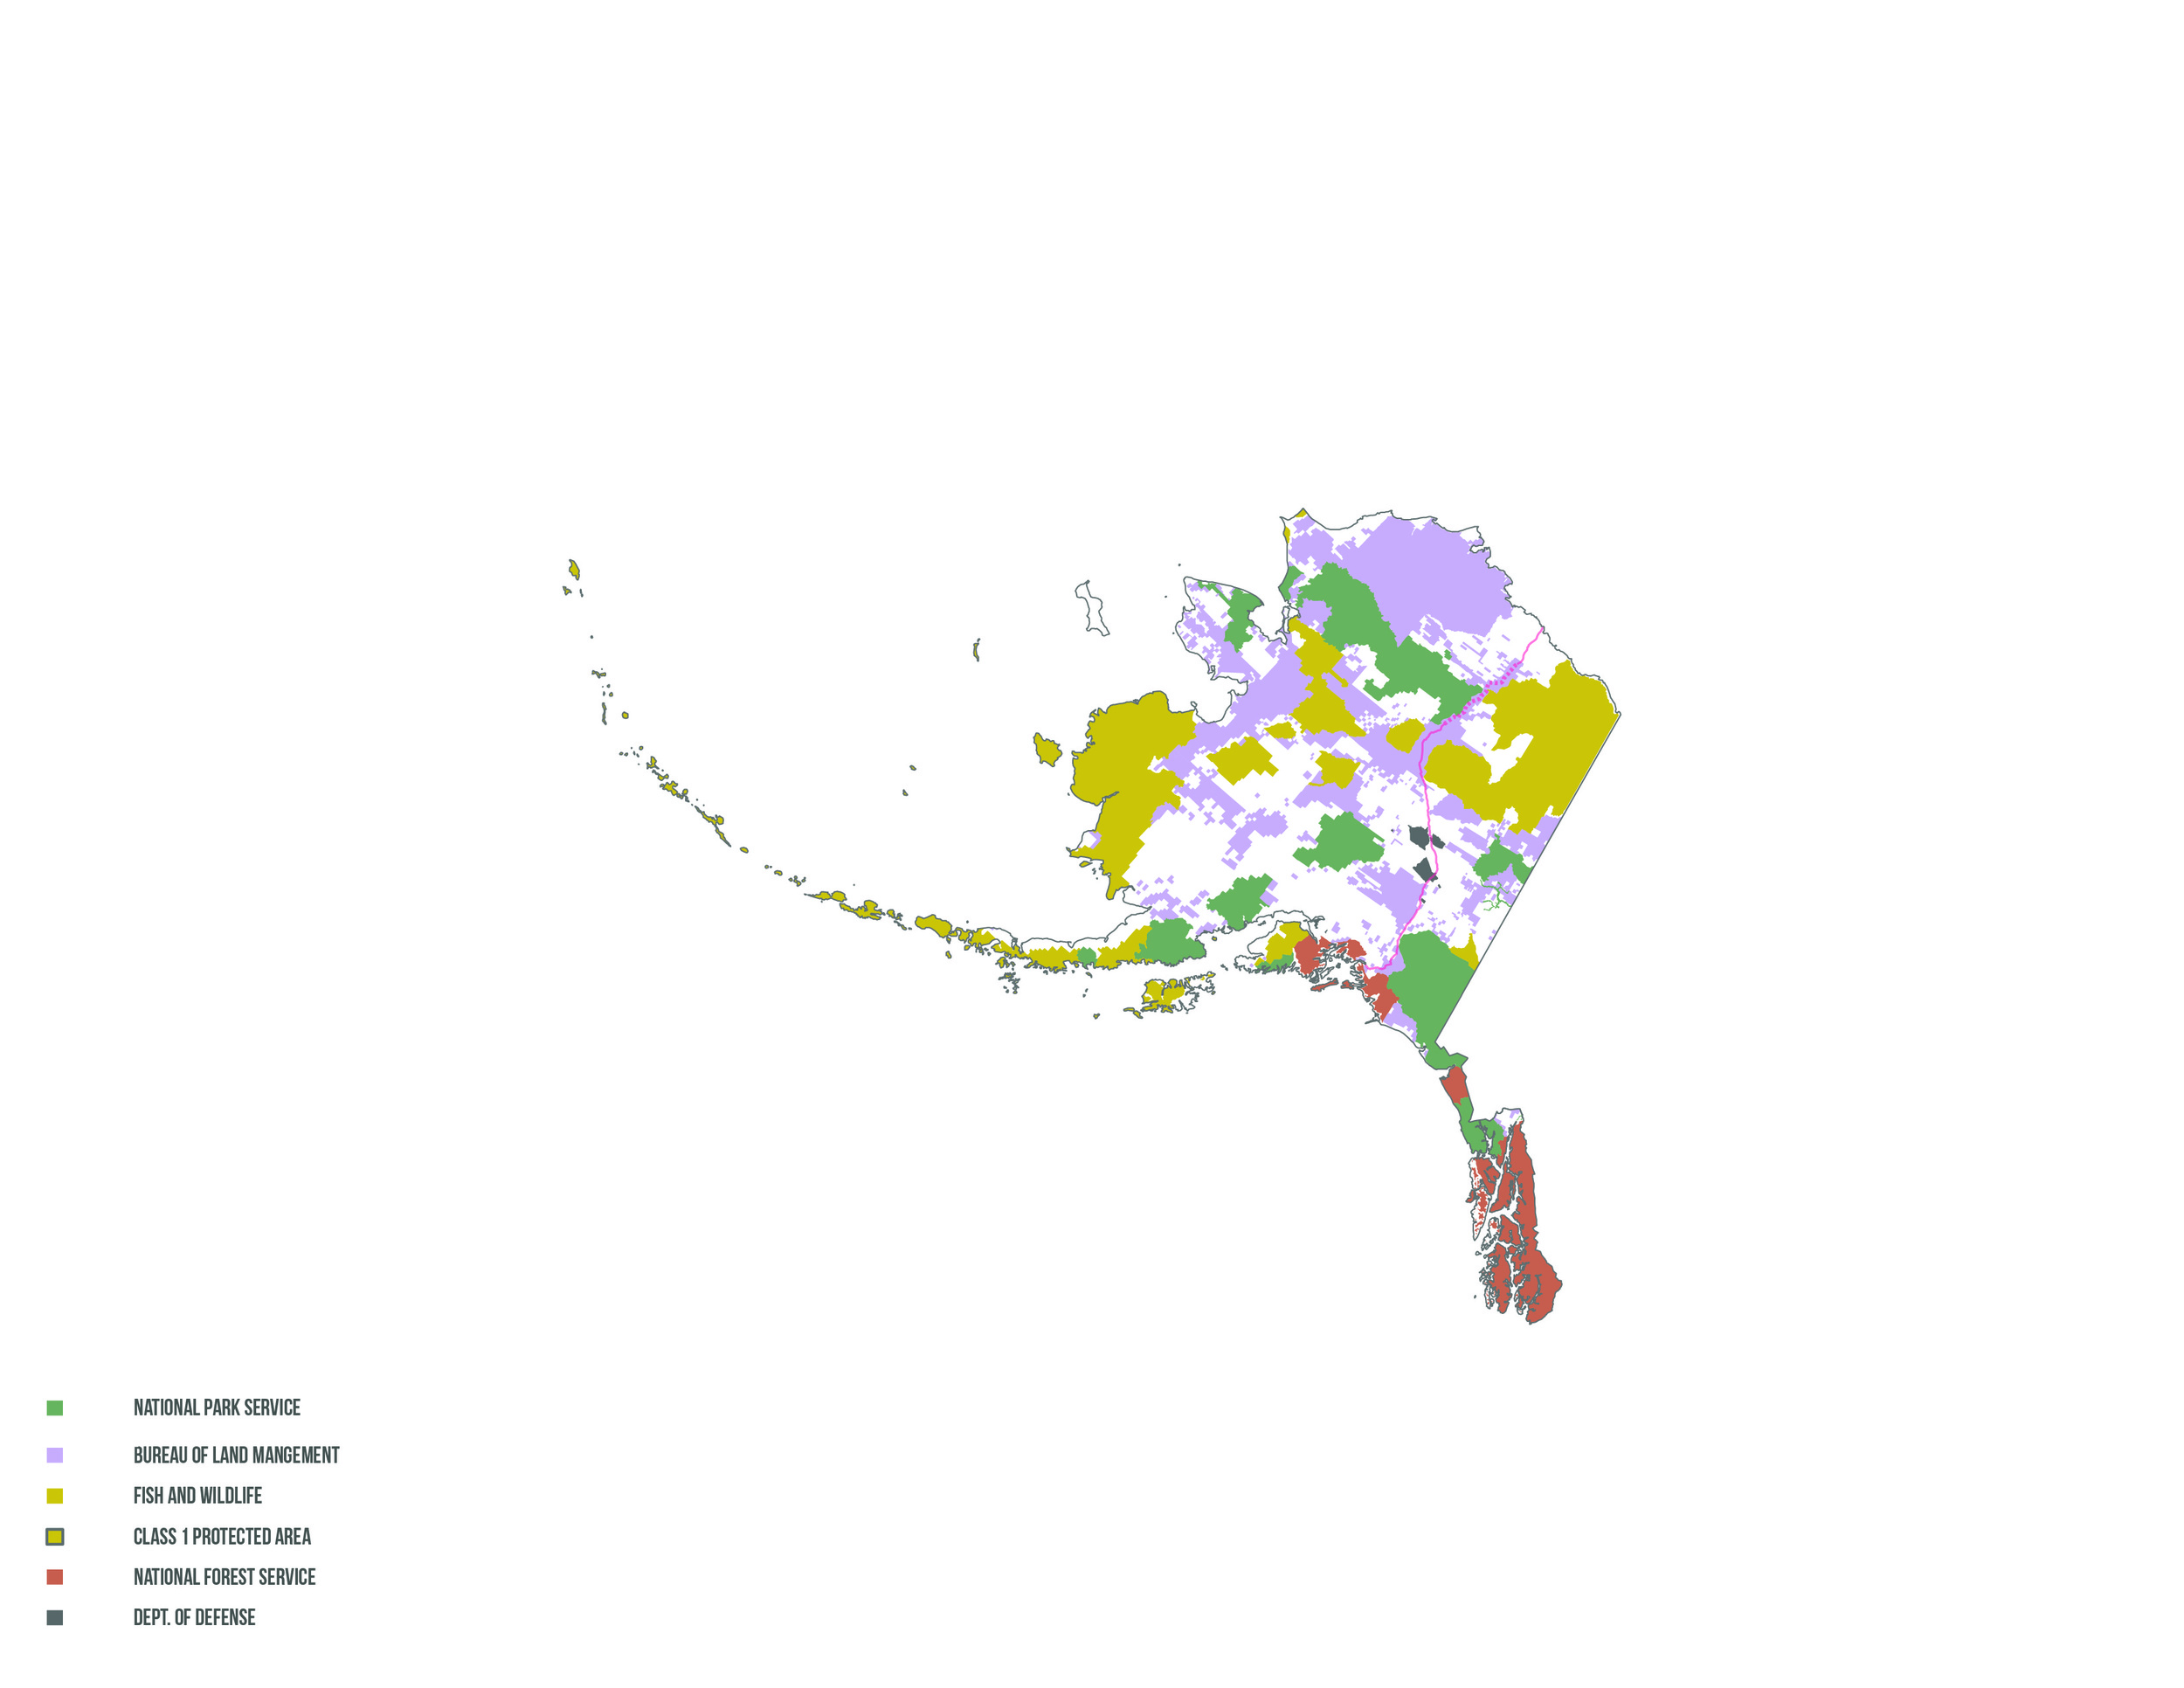
Public Lands
61% of Alaska’s 364.5 million acres are federal lands. Roughly half of these lands have multiple use mandates which enables extraction for the benefit of the public.
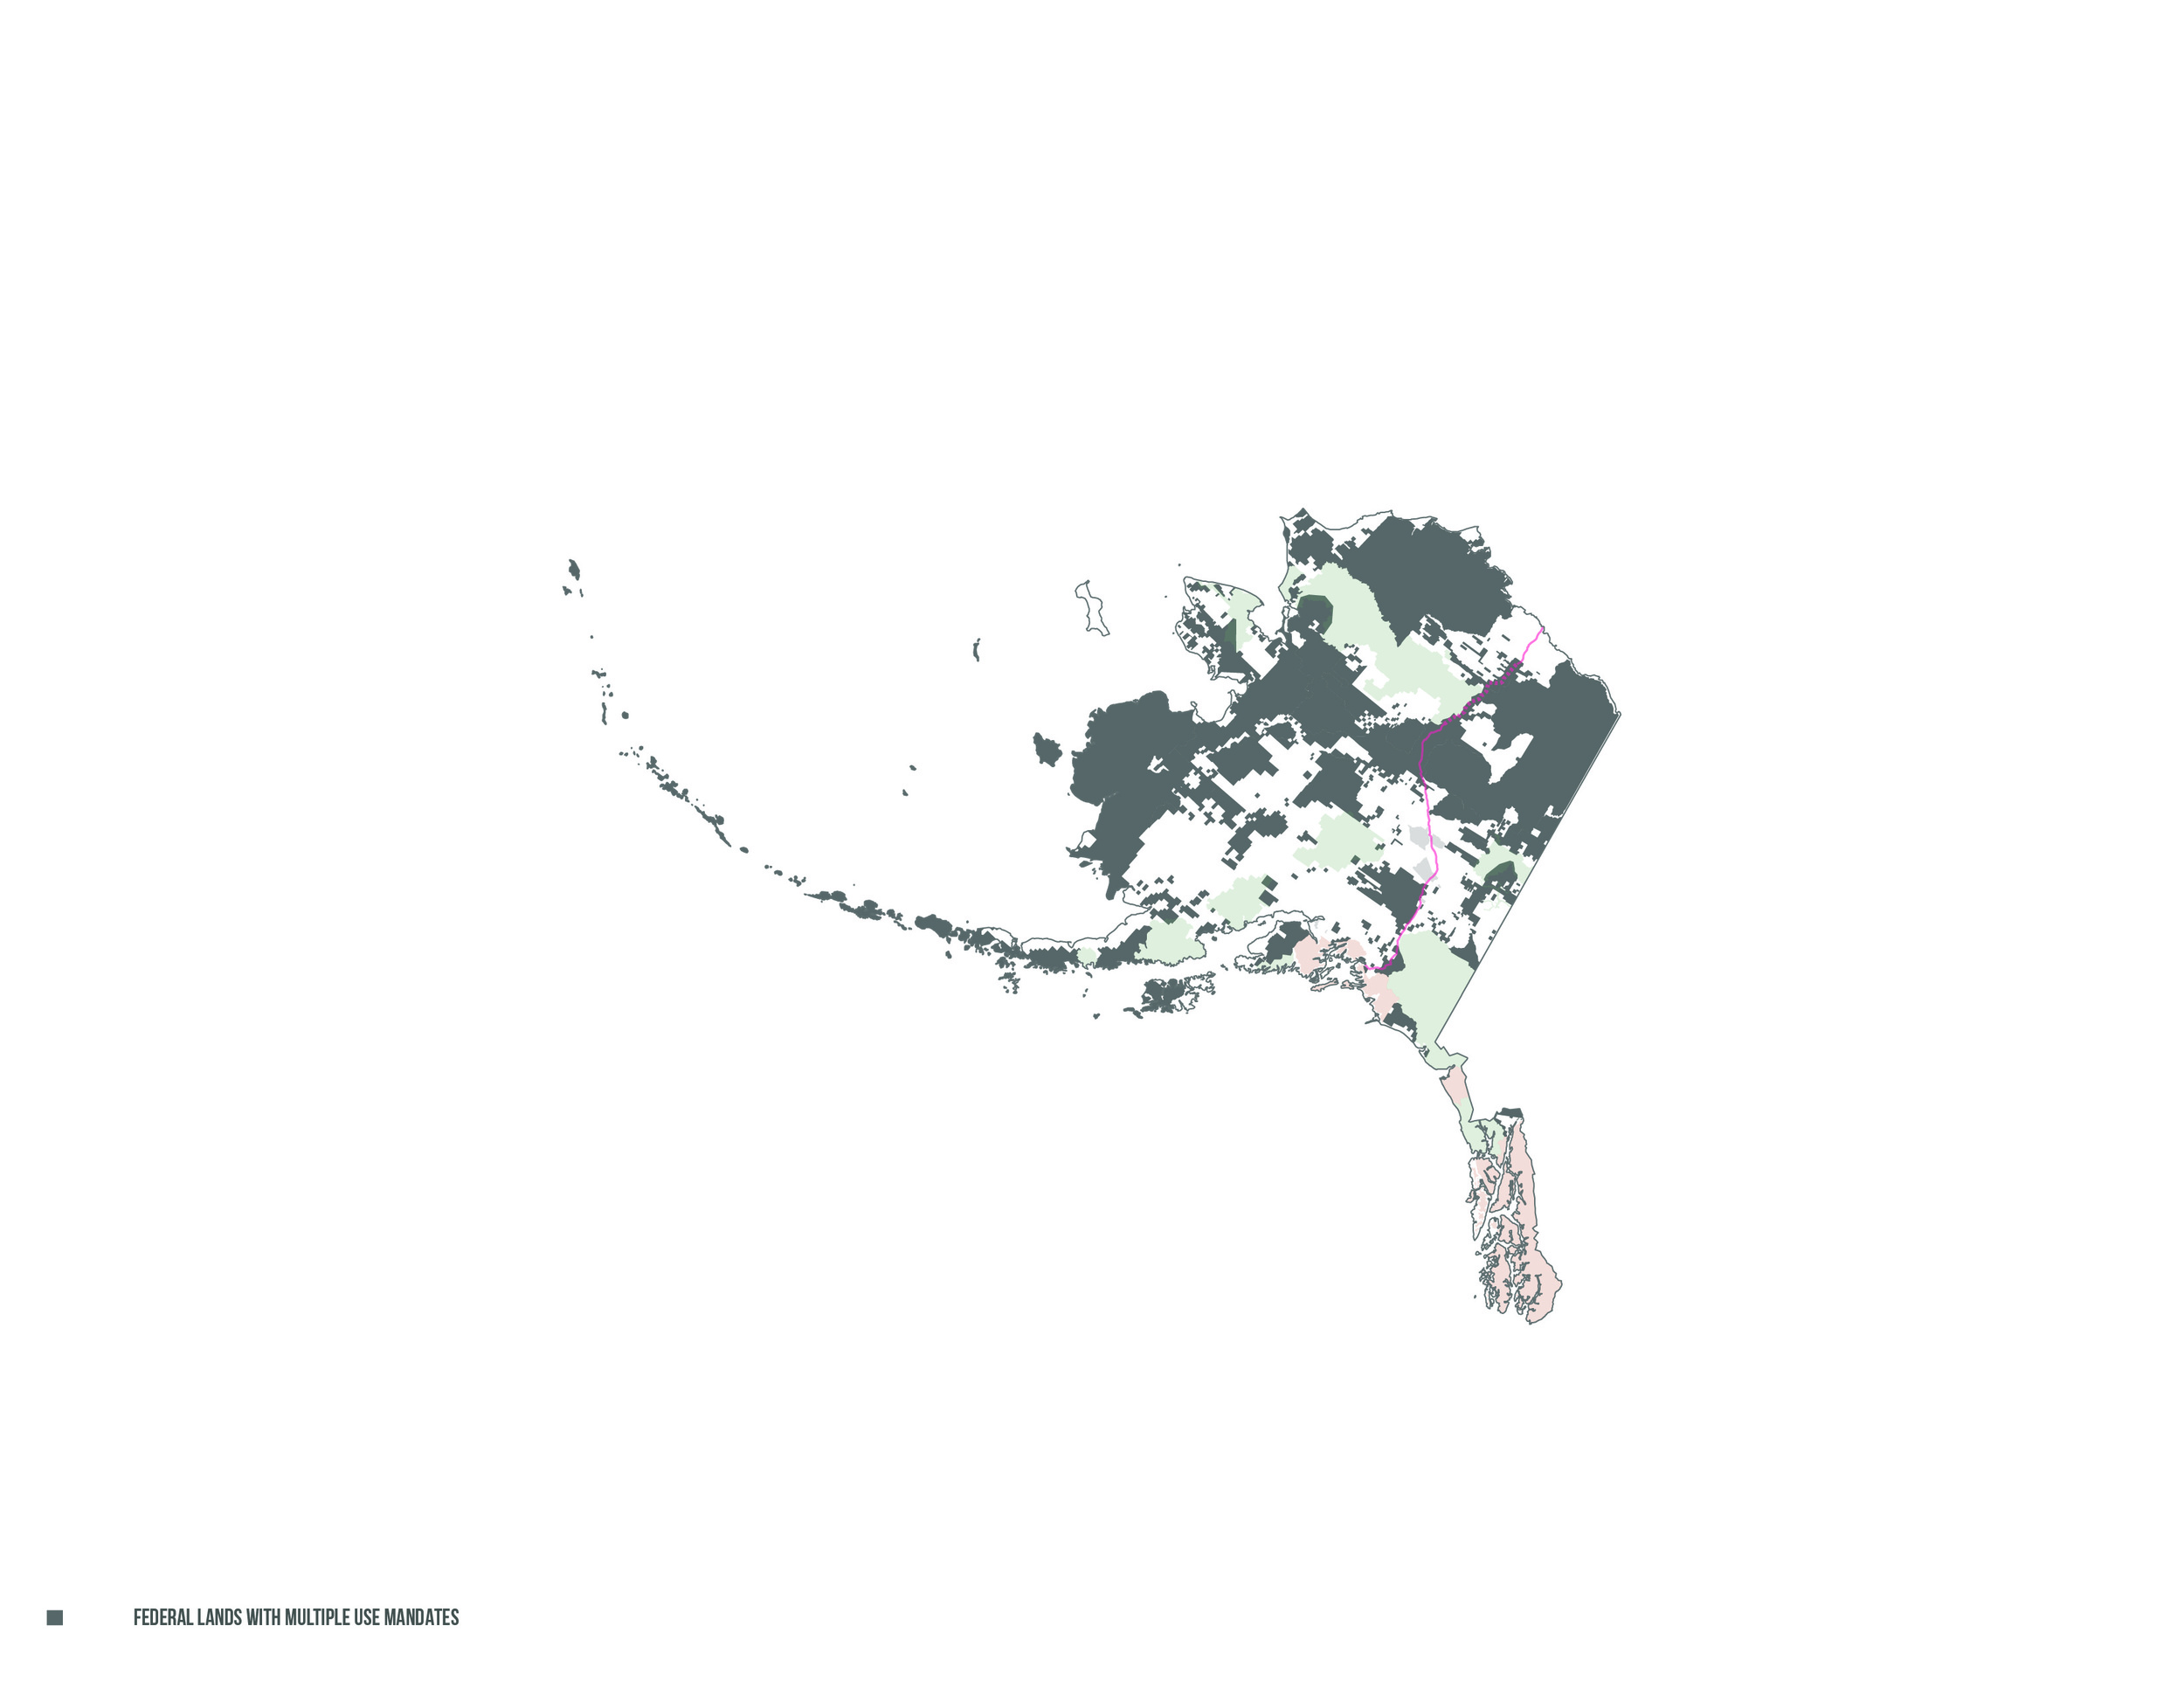
Multiple Use Mandate
The U.S. Forest Service (21.9 million acres), Fish and Wildlife Service (69.4 million acres) and Bureau of Land Management (74.7 million acres) lands hold abundant potentials for renewable energy.
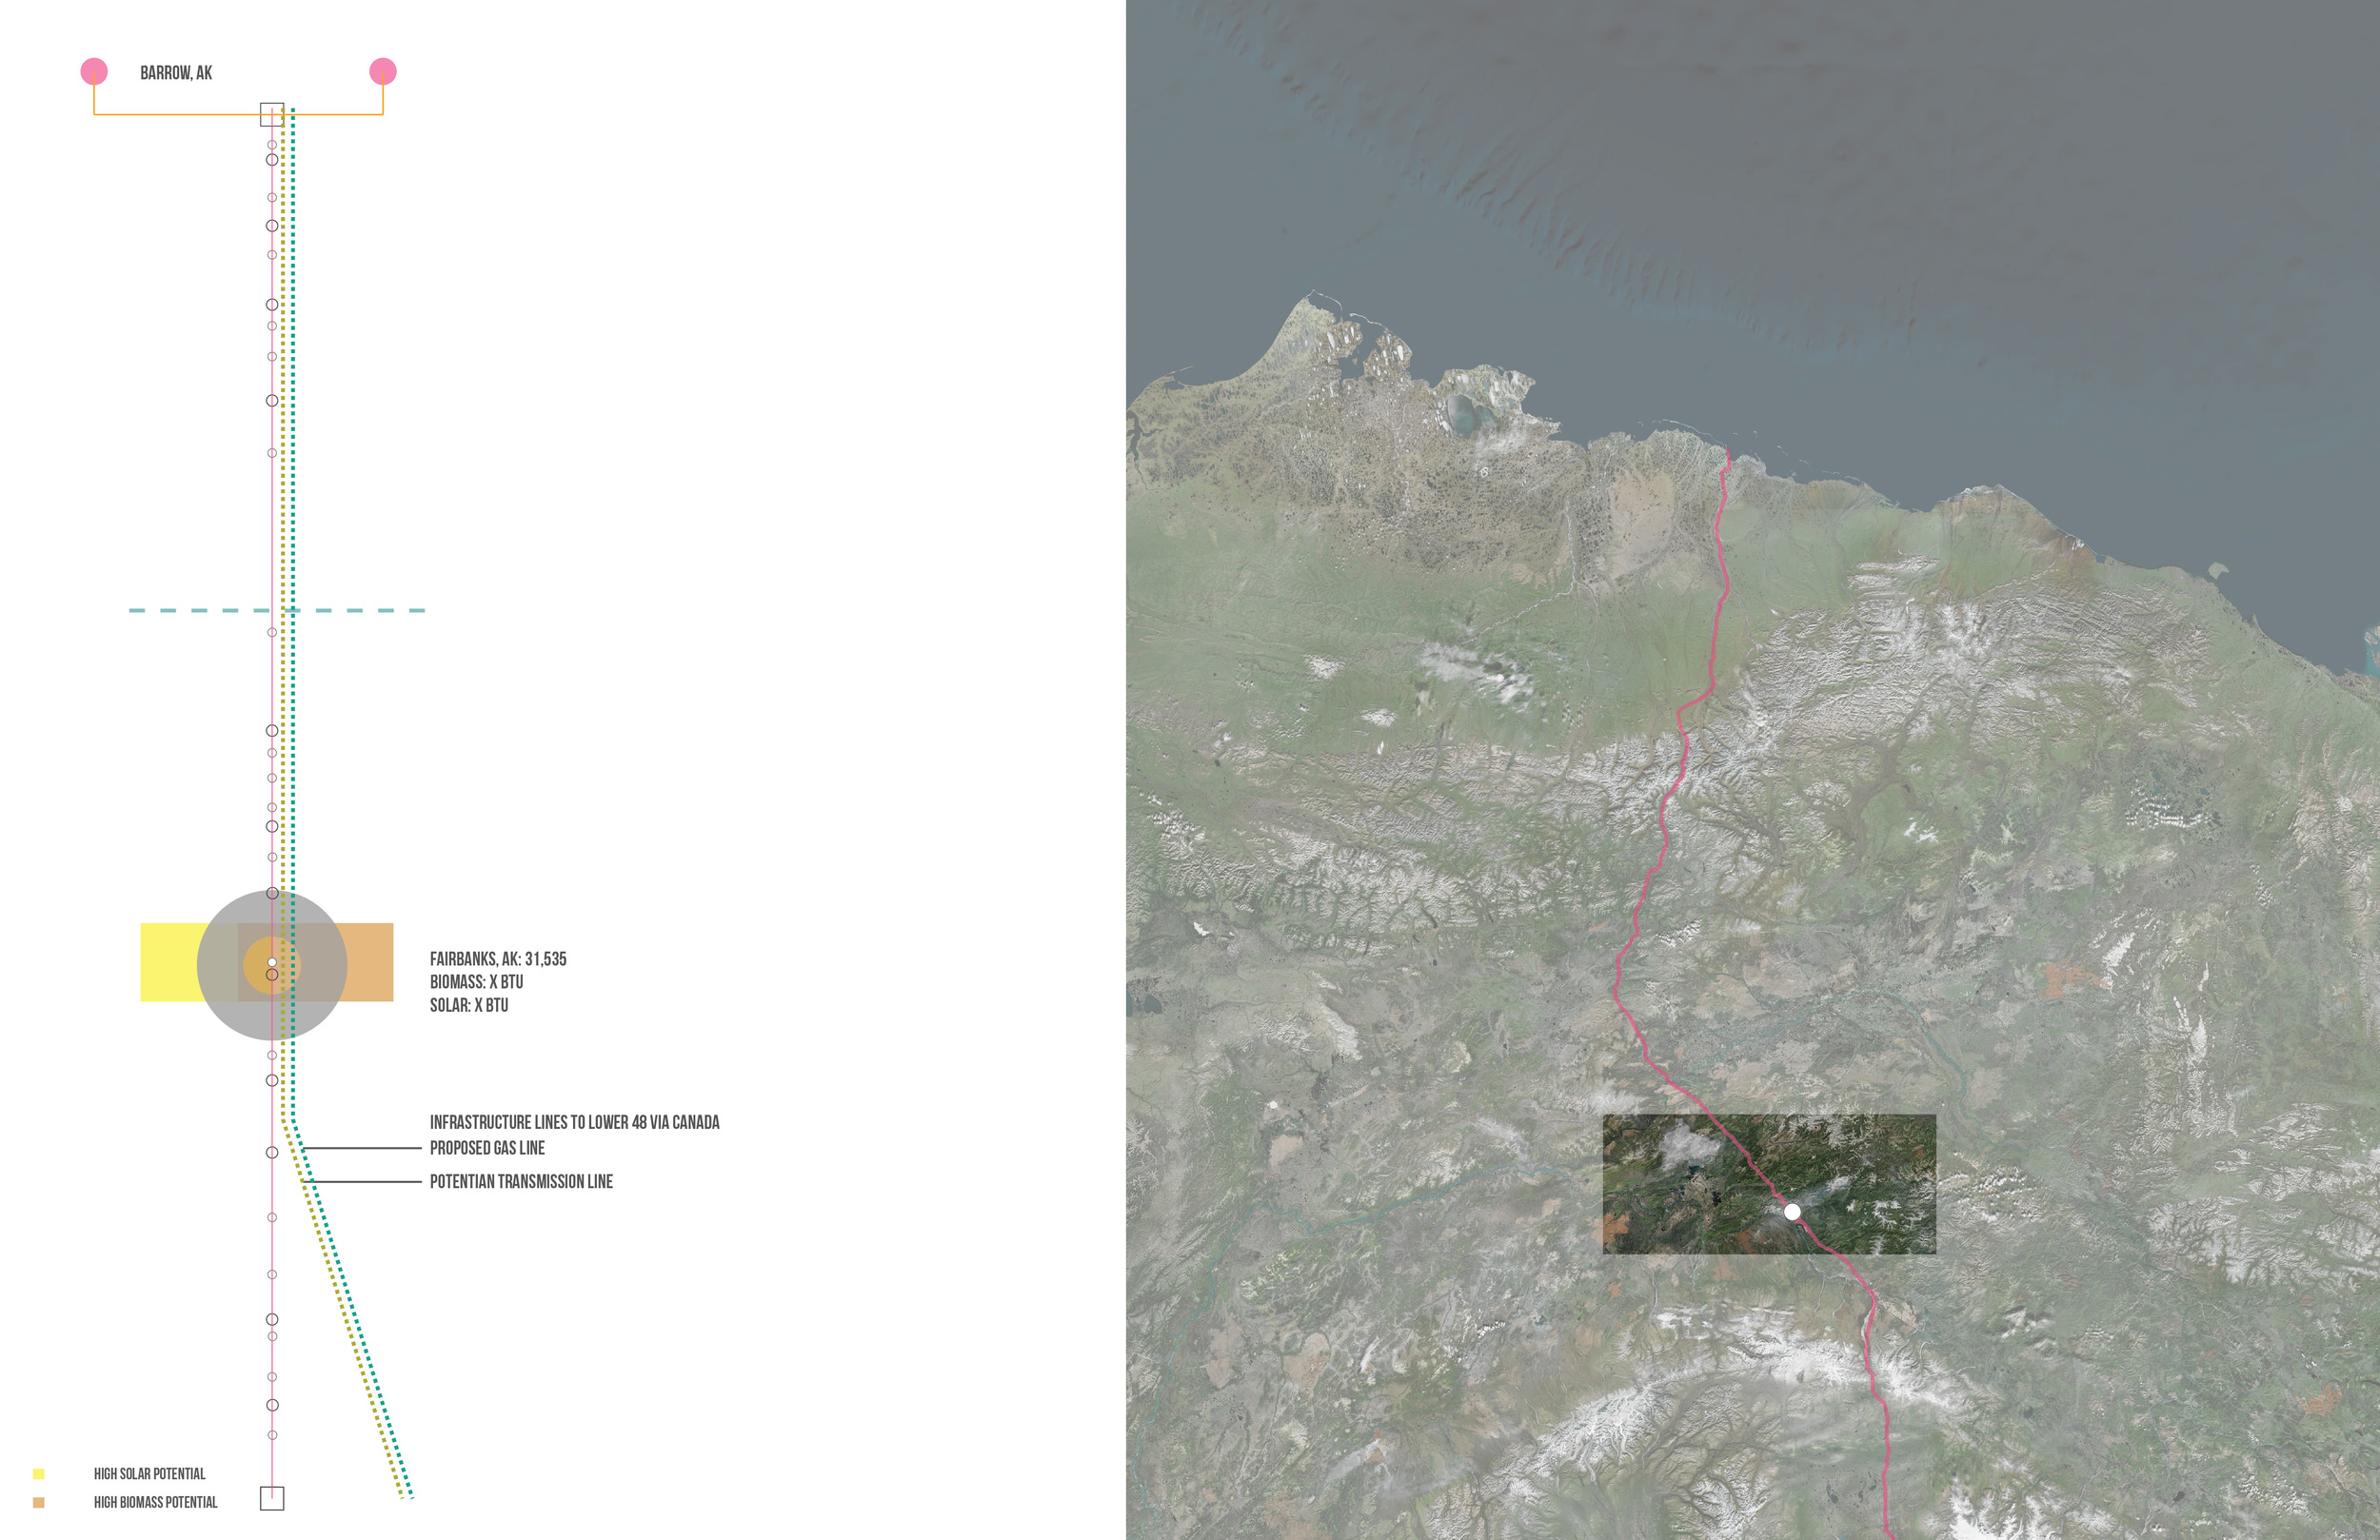
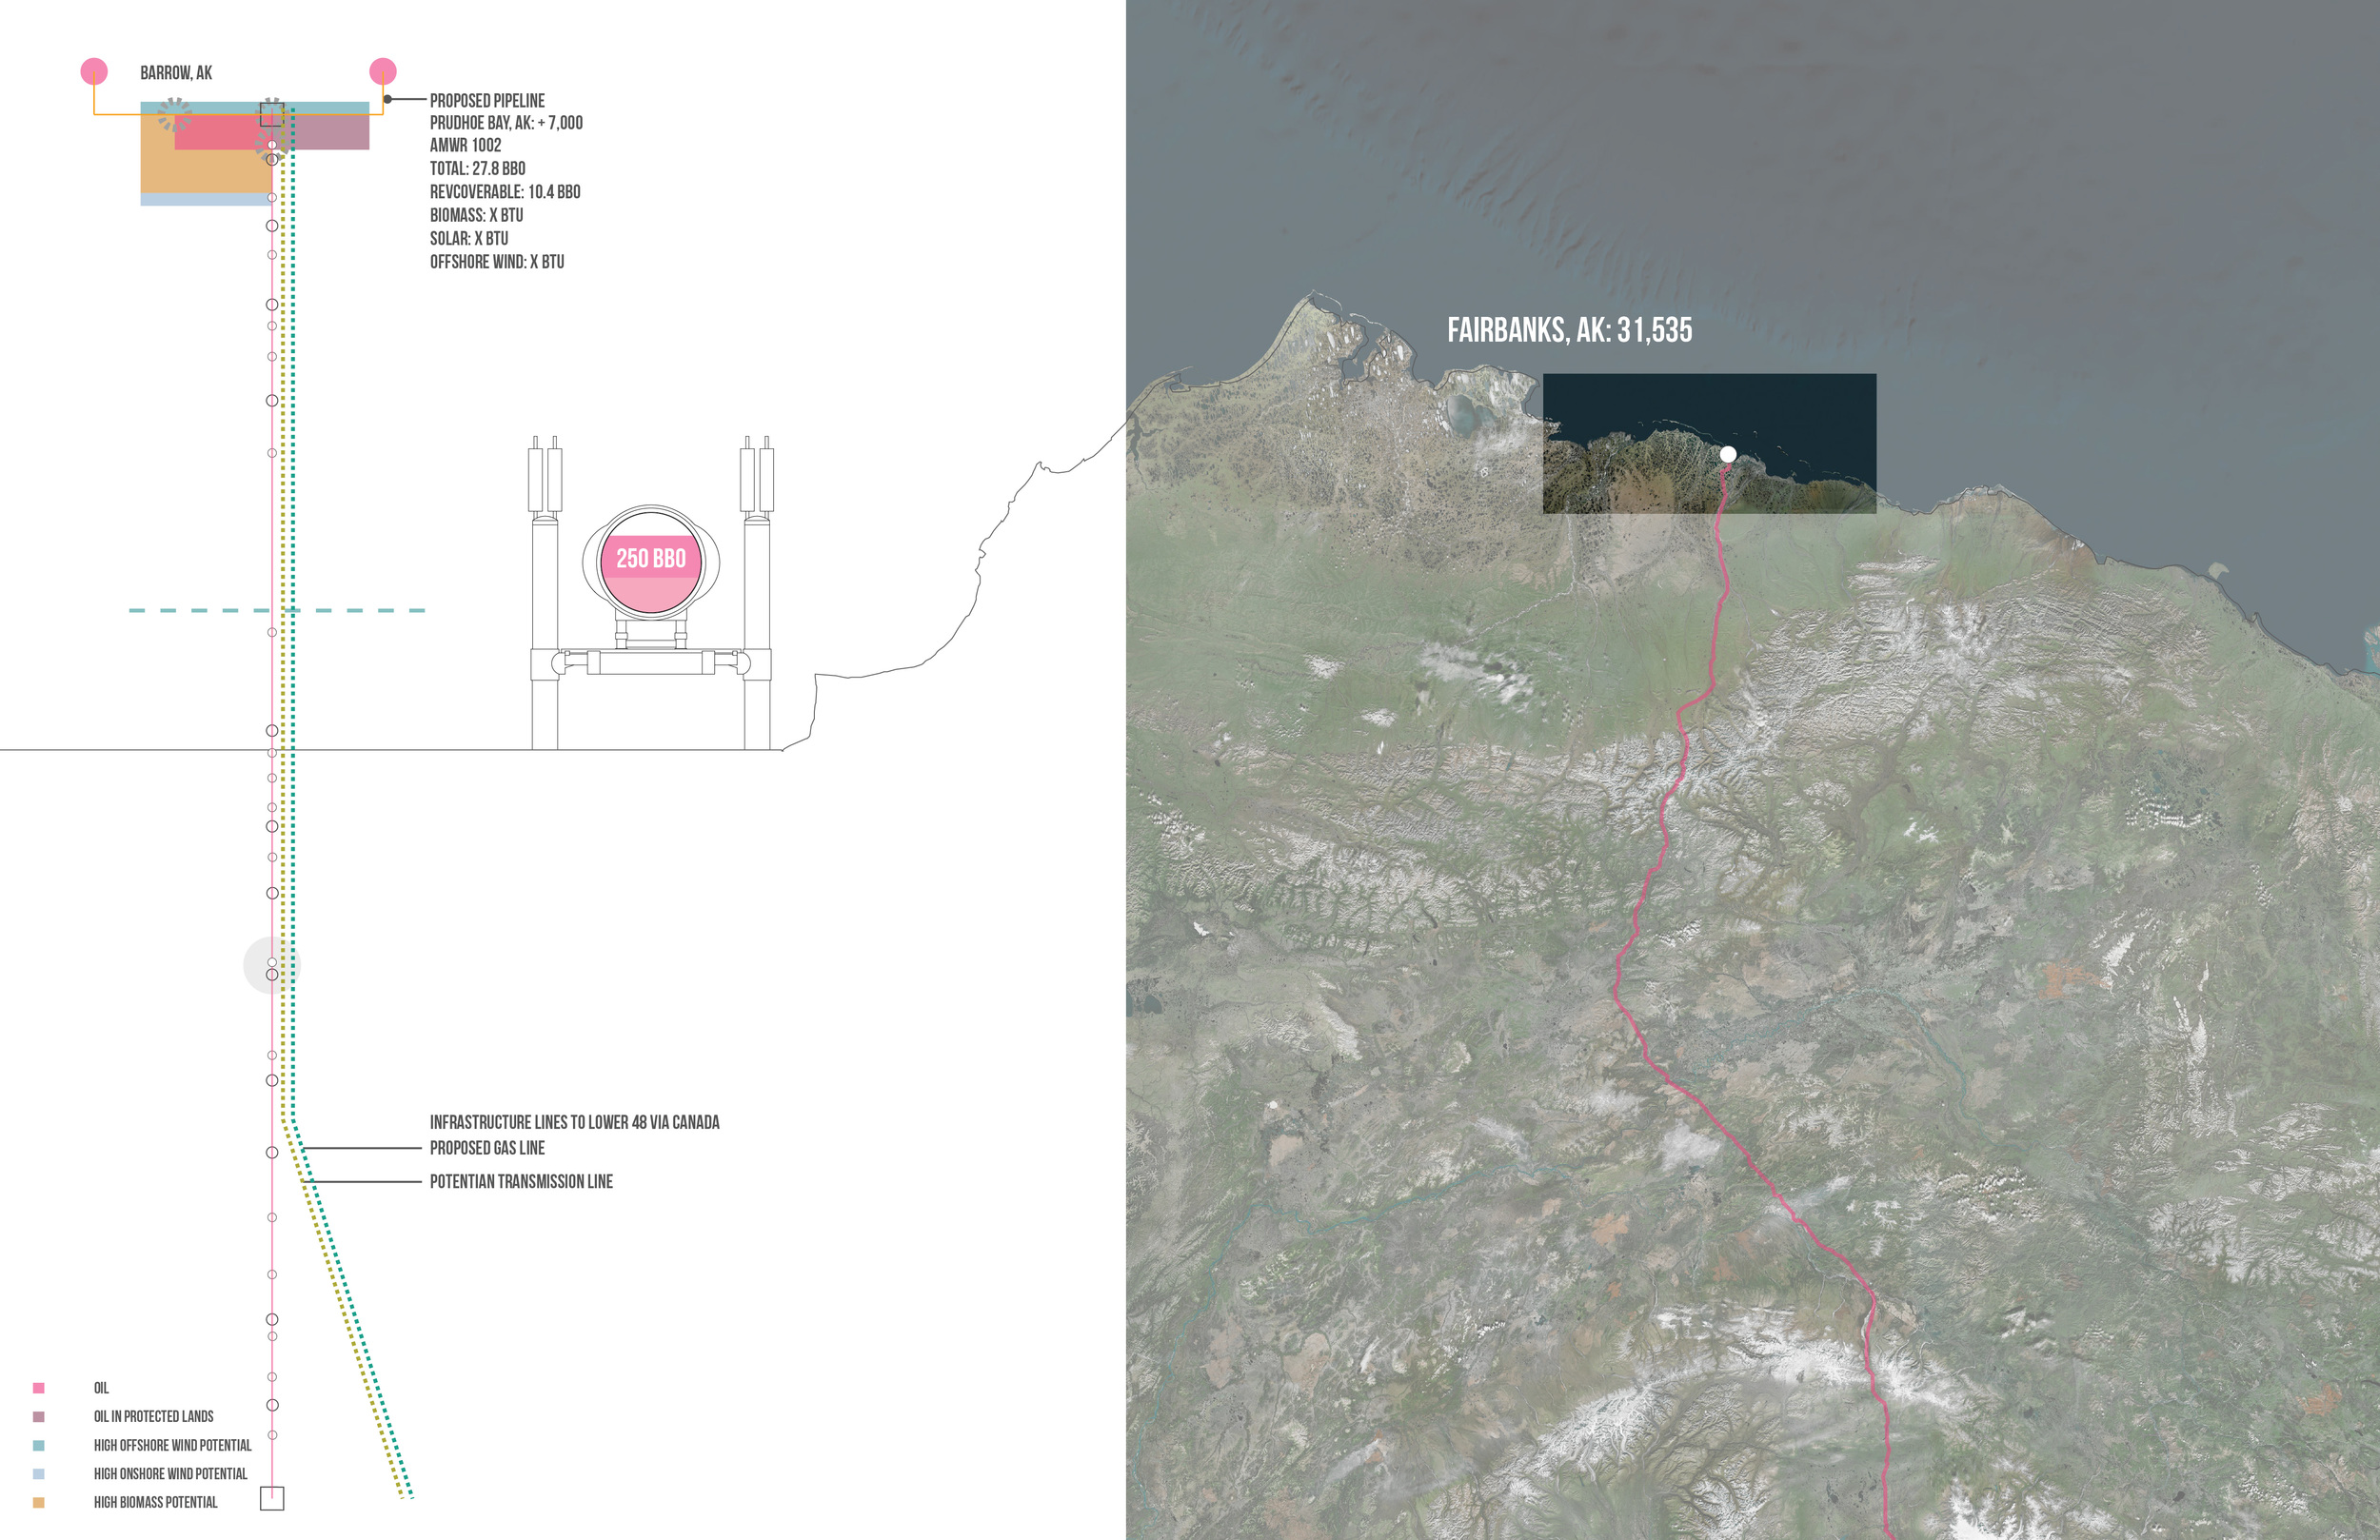
Fairbanks 2012
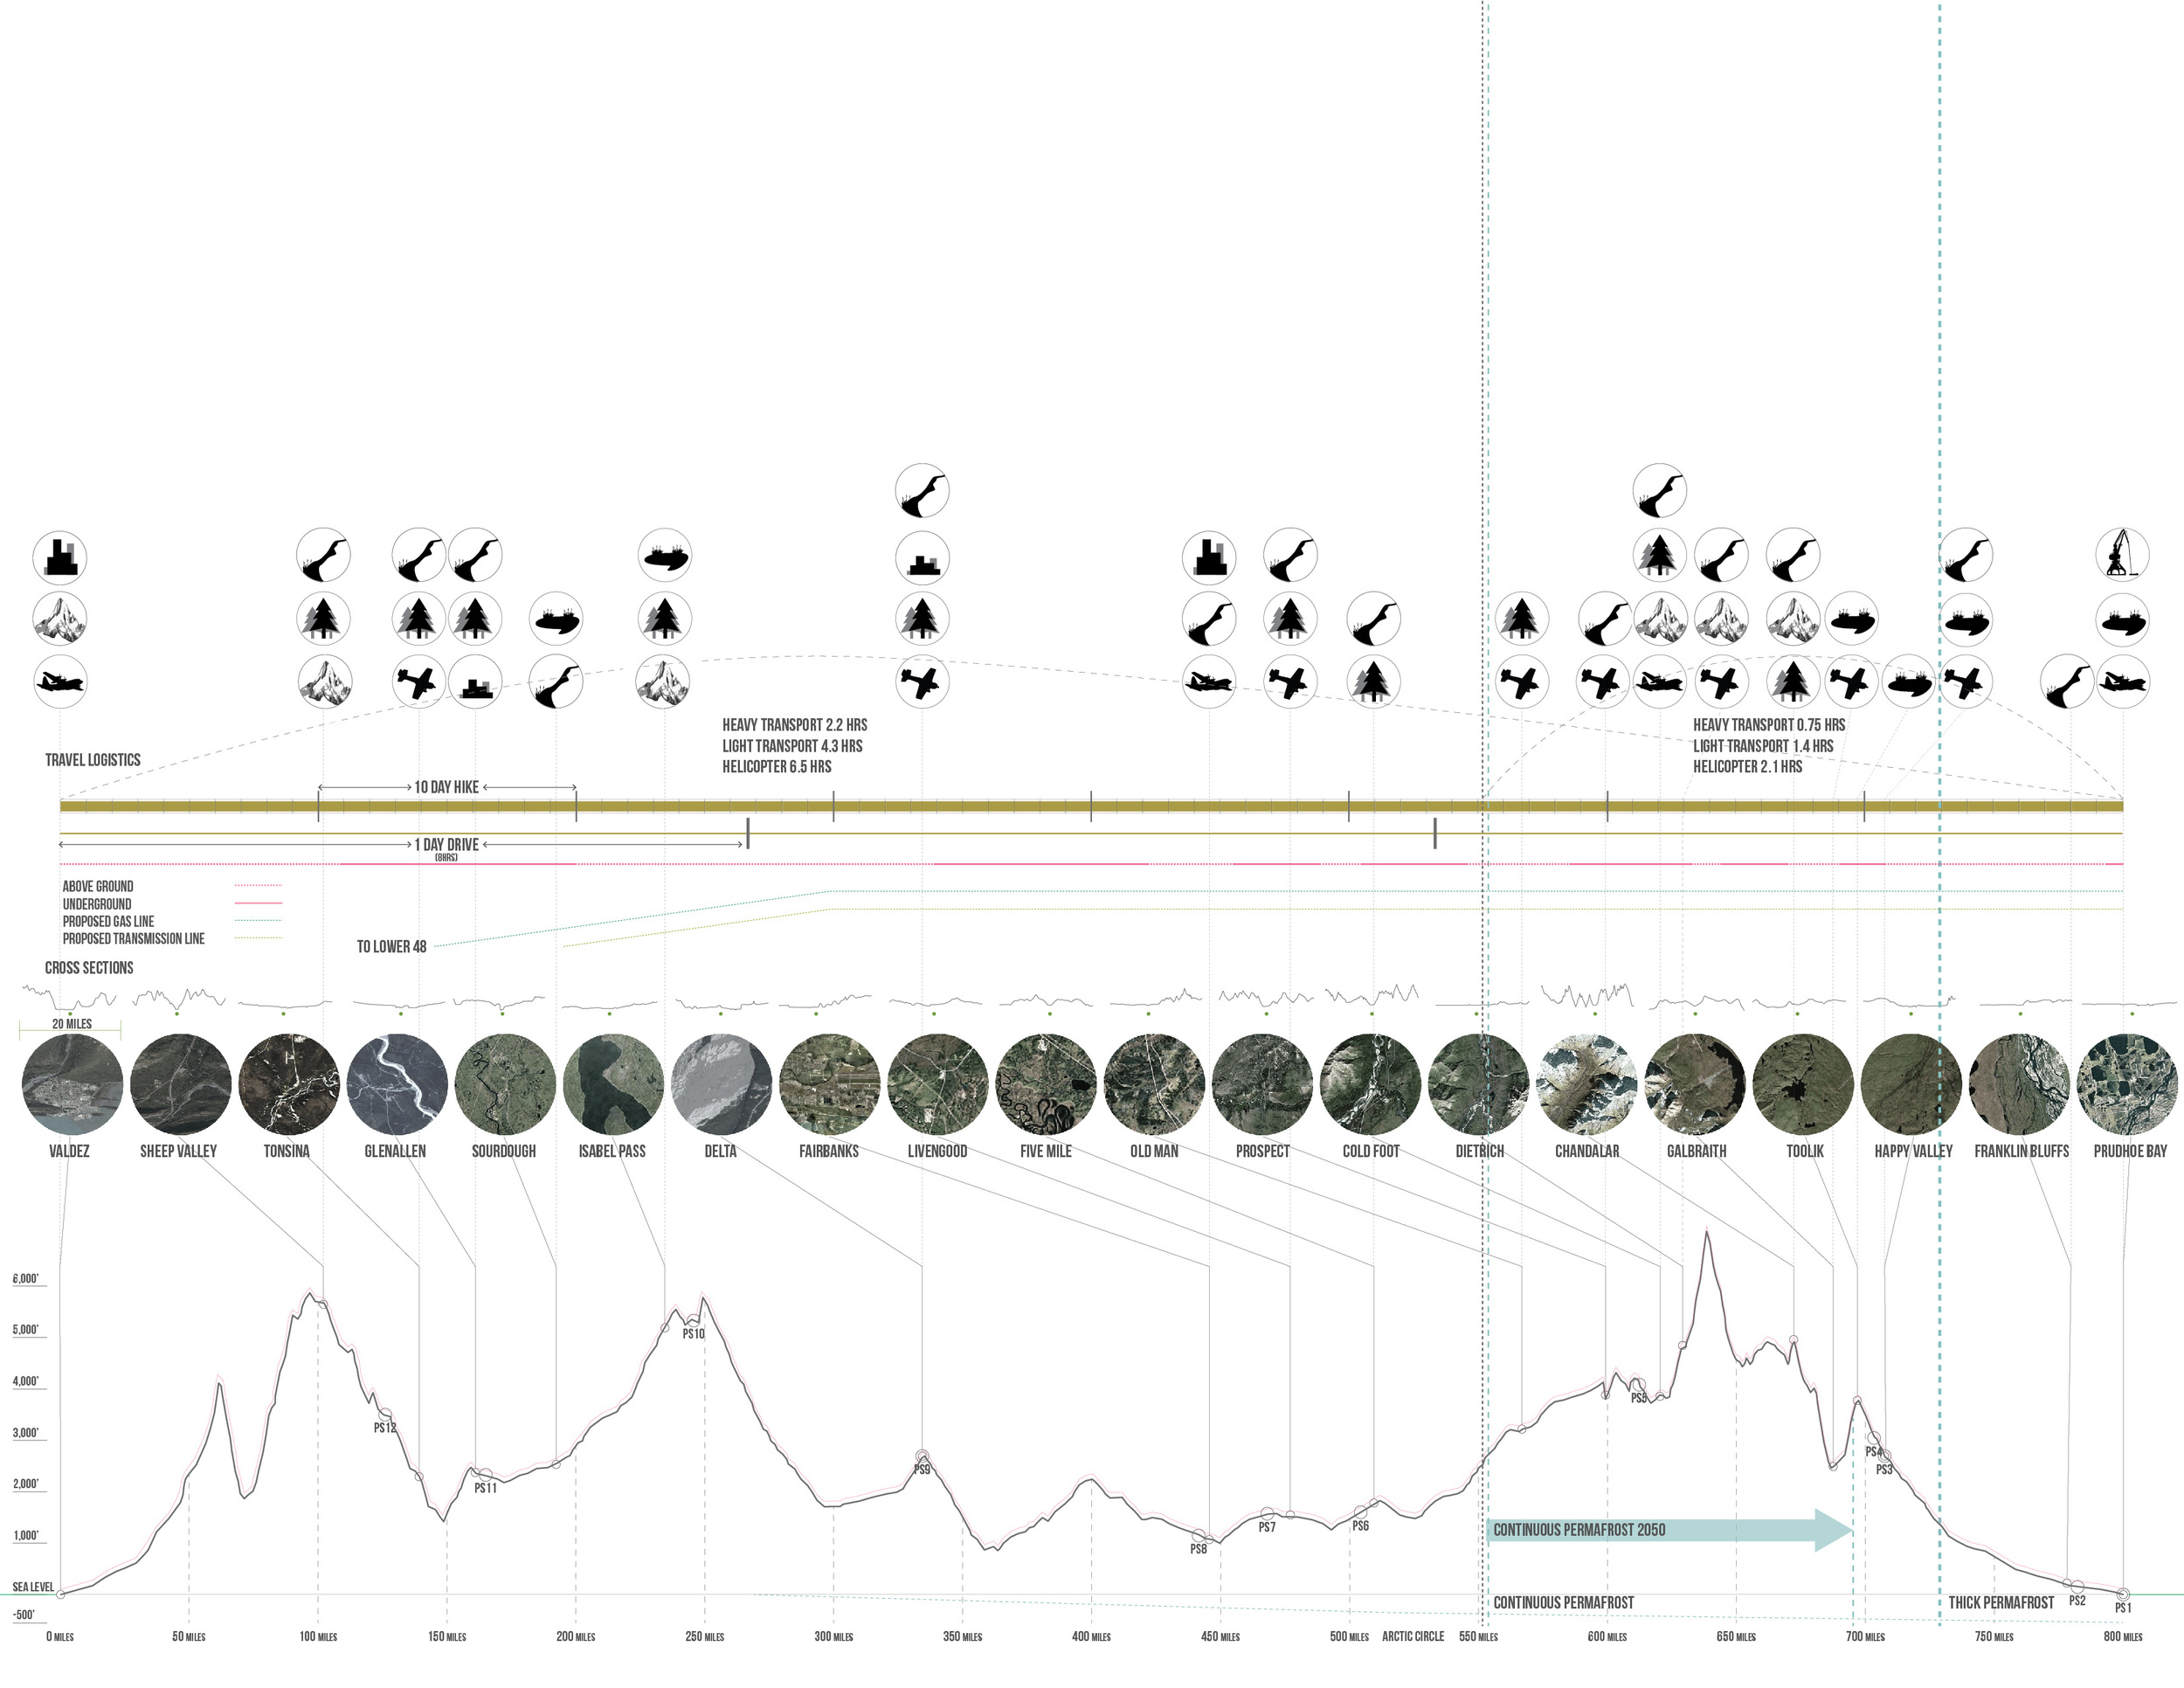
To understand the potentials of harvesting renewable energy from the Alaskan landscape and the alternative economic potentials that it can enable, we can use three sites along the Trans-Alaskan pipeline as case studies.
Fairbanks is the 8th camp along the pipeline. This camp, like the other 20, is abandoned but has utility hookups and basic infrastructures. The camp is located near a large town and surrounded by Bureau of Land Management and Fish and Wildlife lands. Within these adjacent federal lands there is a large potential for solar and biomass energy production.
Fairbanks 2015
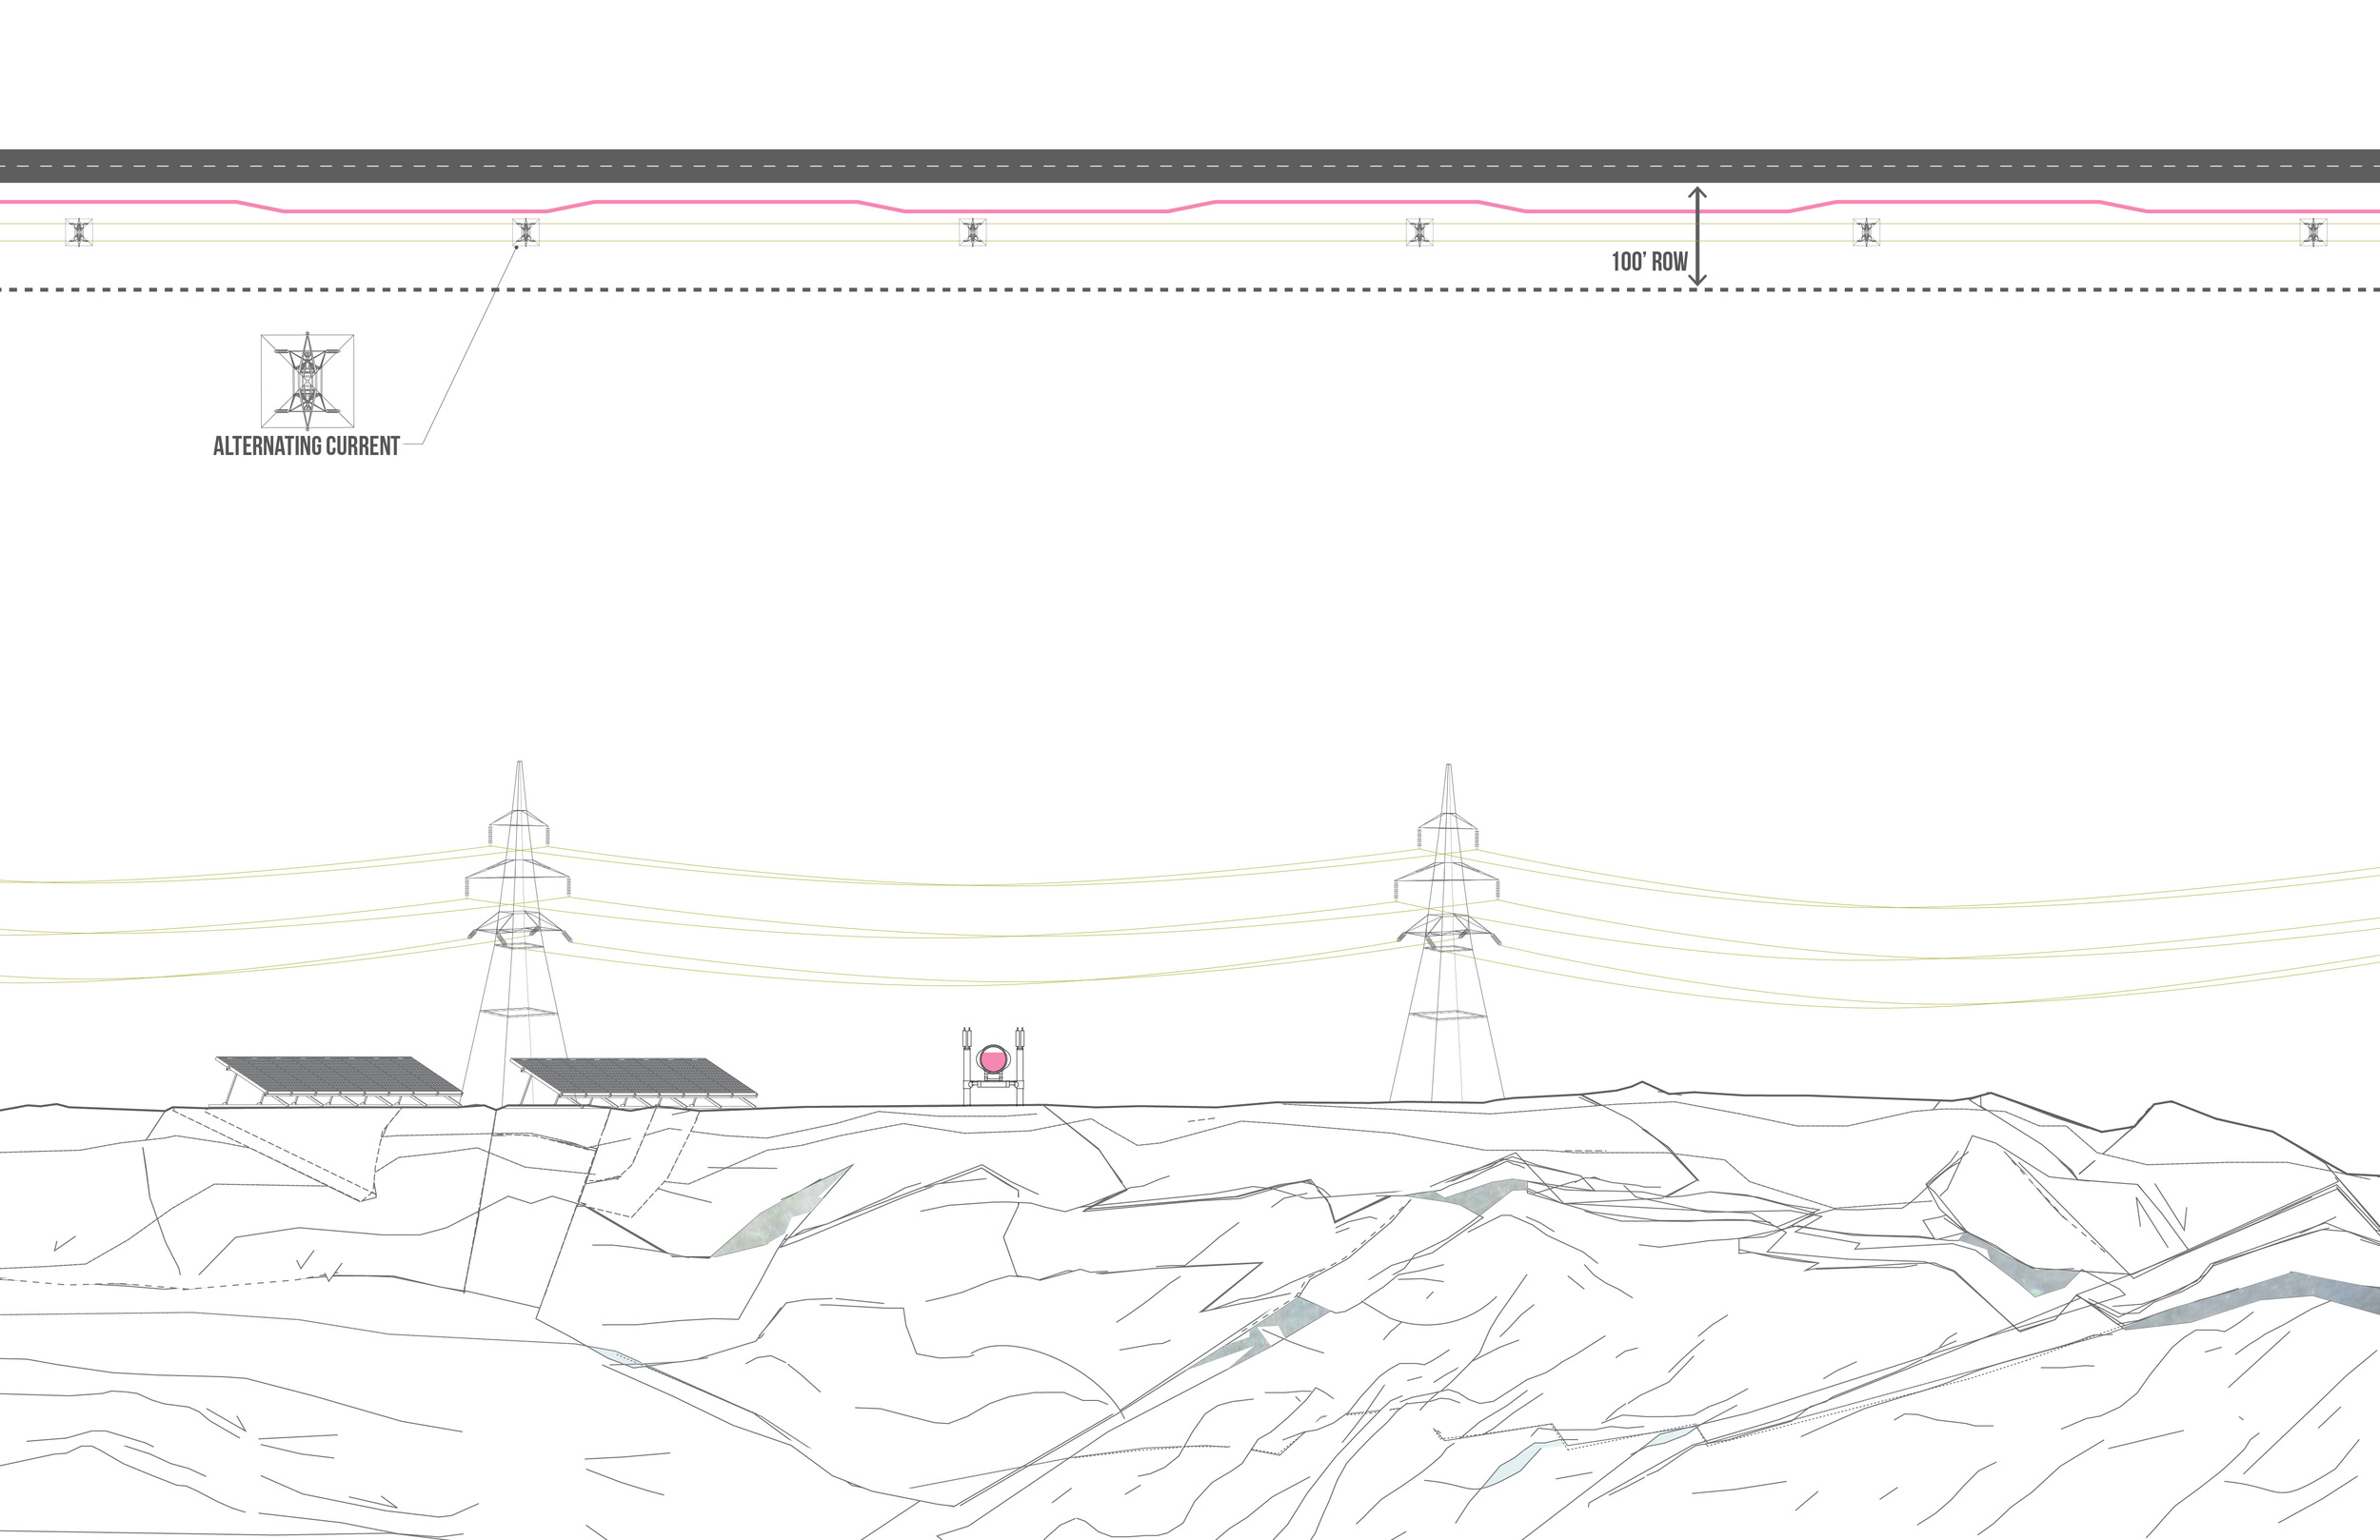
To make Alaska resilient to a post peak bust the state must begin seeding the renewable energy infrastructure when offshore oil drilling begins. Operations can begin by building a transformation station to tie the future solar farm and other future energy sources into the U.S. electrical grid.
In addition to the creation of solar fields, the clearing and seeding for a biomass farm will provide the resources for future renewable extraction at Fairbanks.
Simultaneous to the construction of the energy hubs all 20 Trans-Alaskan pipeline camps could be renovated to accommodate regional tourism. Each construction camp can act as a nucleus, serving as the base for local activities and/or renewable energy production.
Fairbanks 2050
When the offshore oil resources begin to dry up the renewable energy systems will be fully operable and deeply embedded in the ecotourism operations.
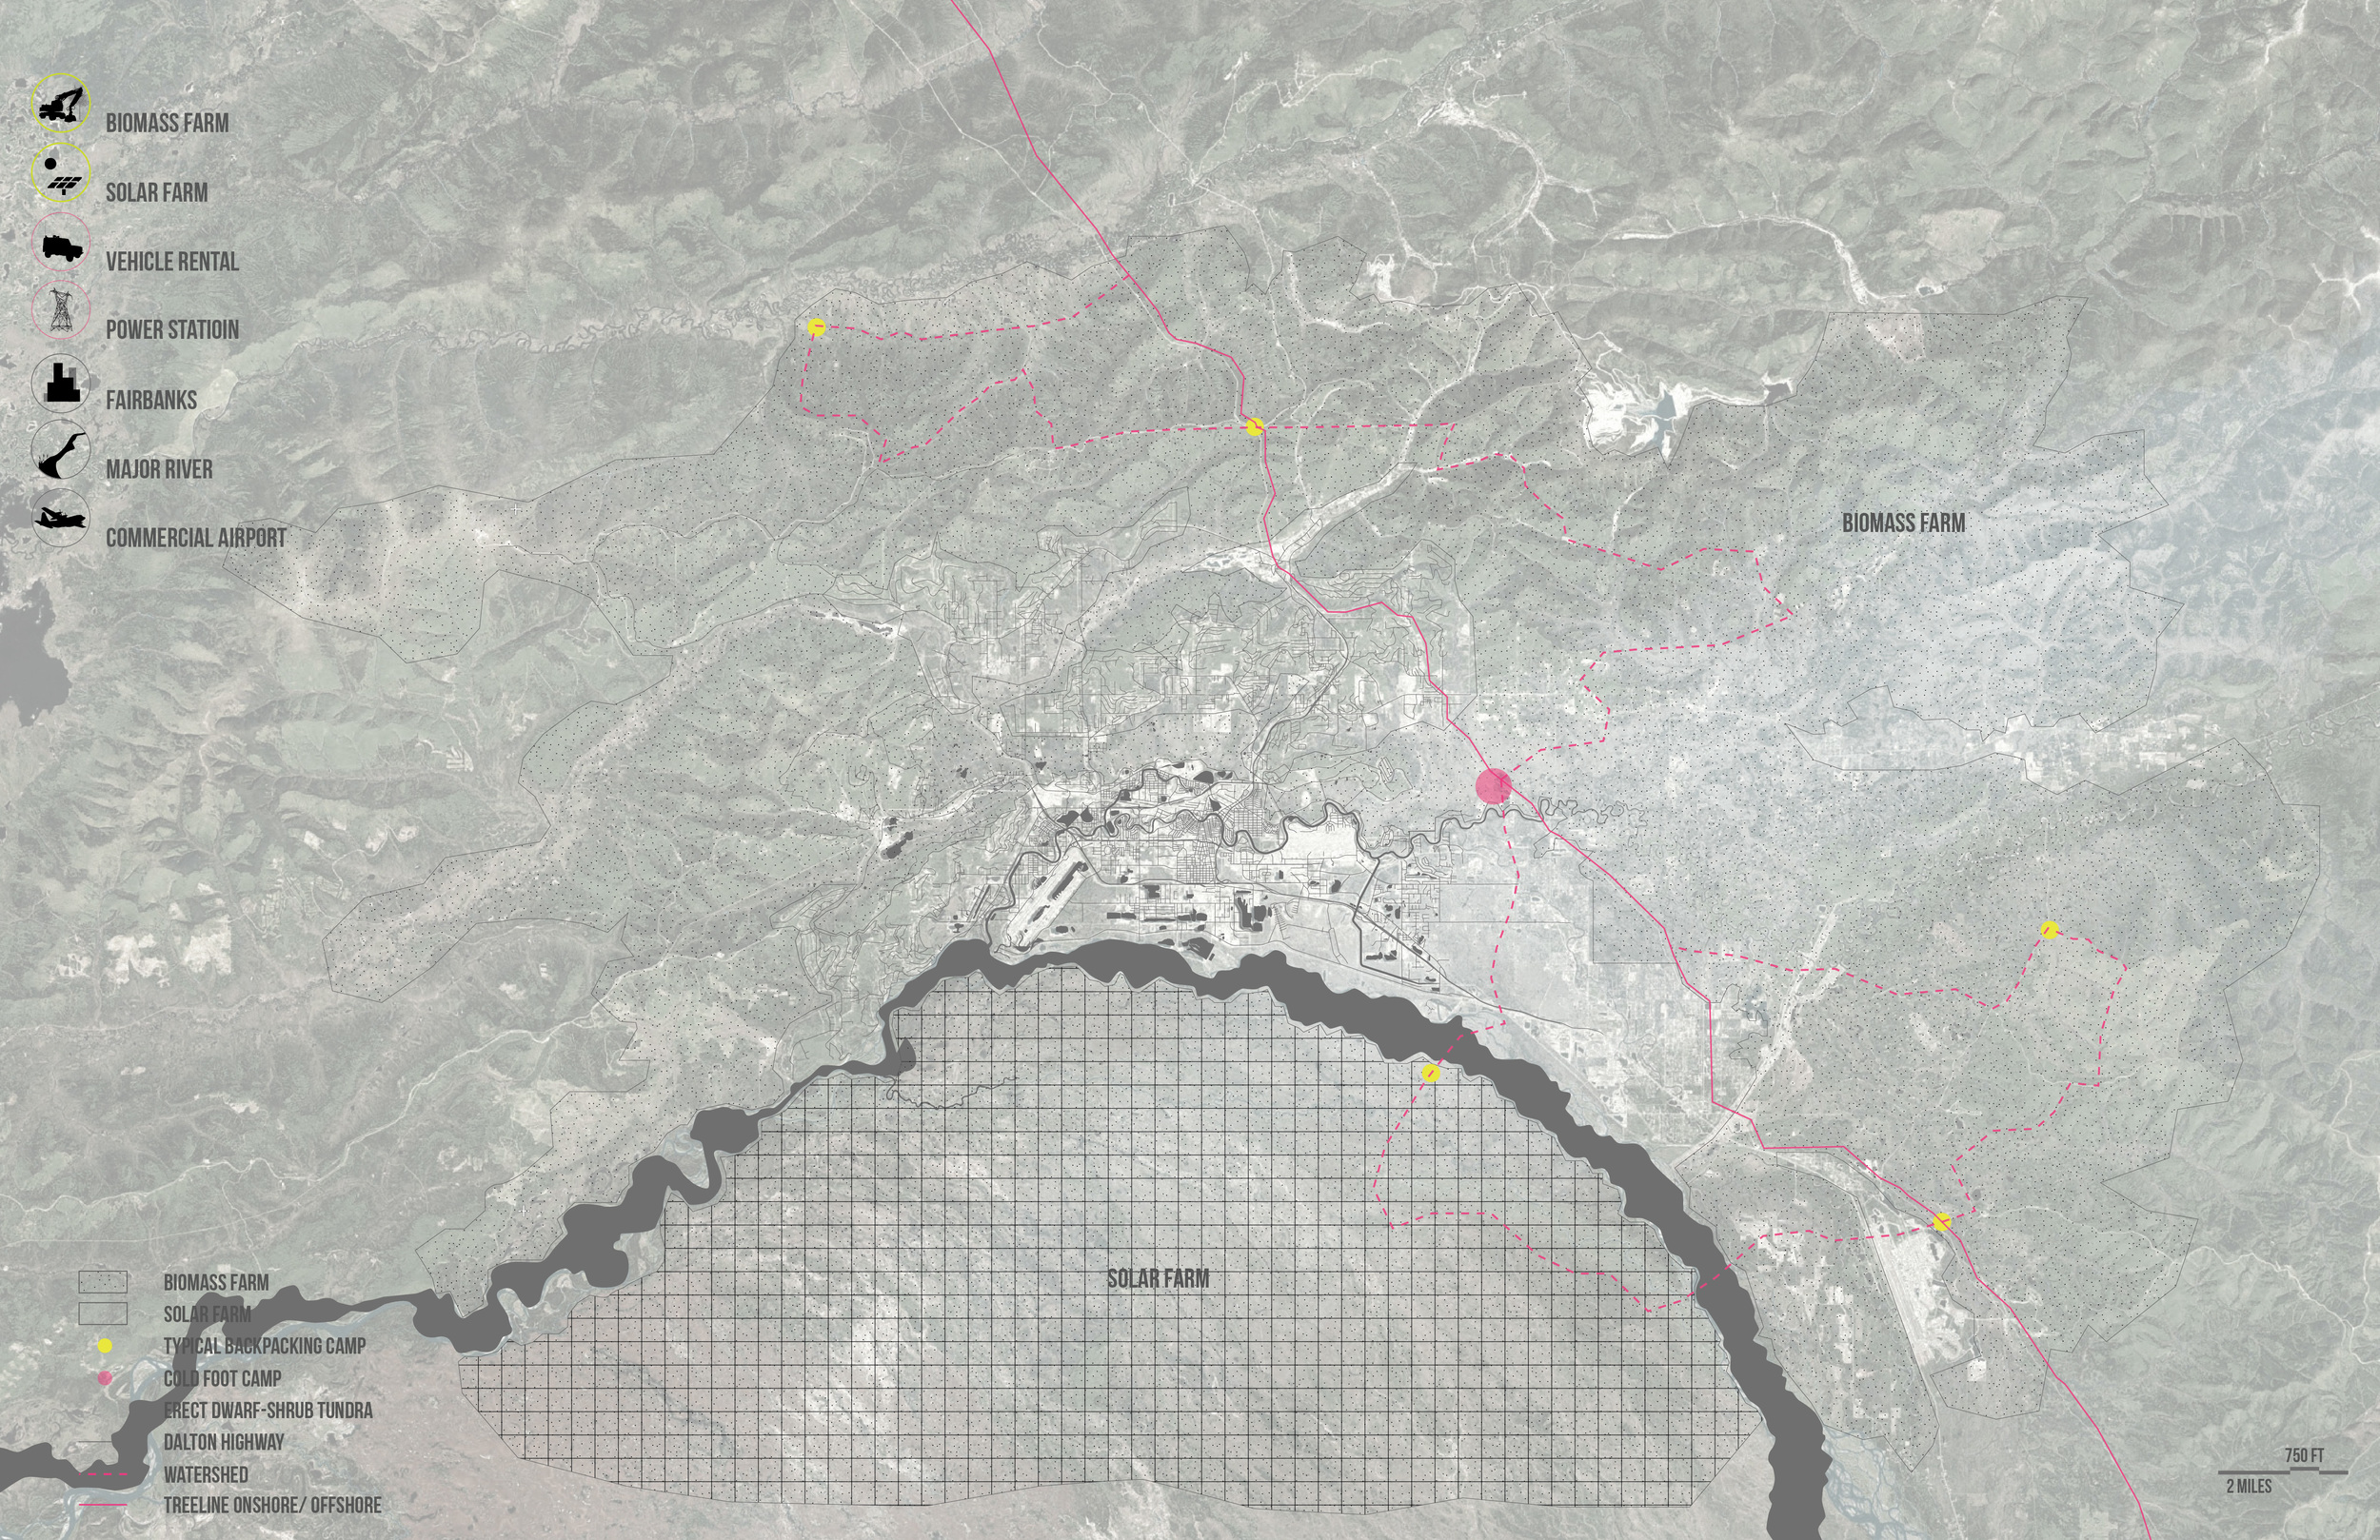
Fairbanks 2050
Around the main Fairbanks Camp several camps can be installed to extend the tourism network.

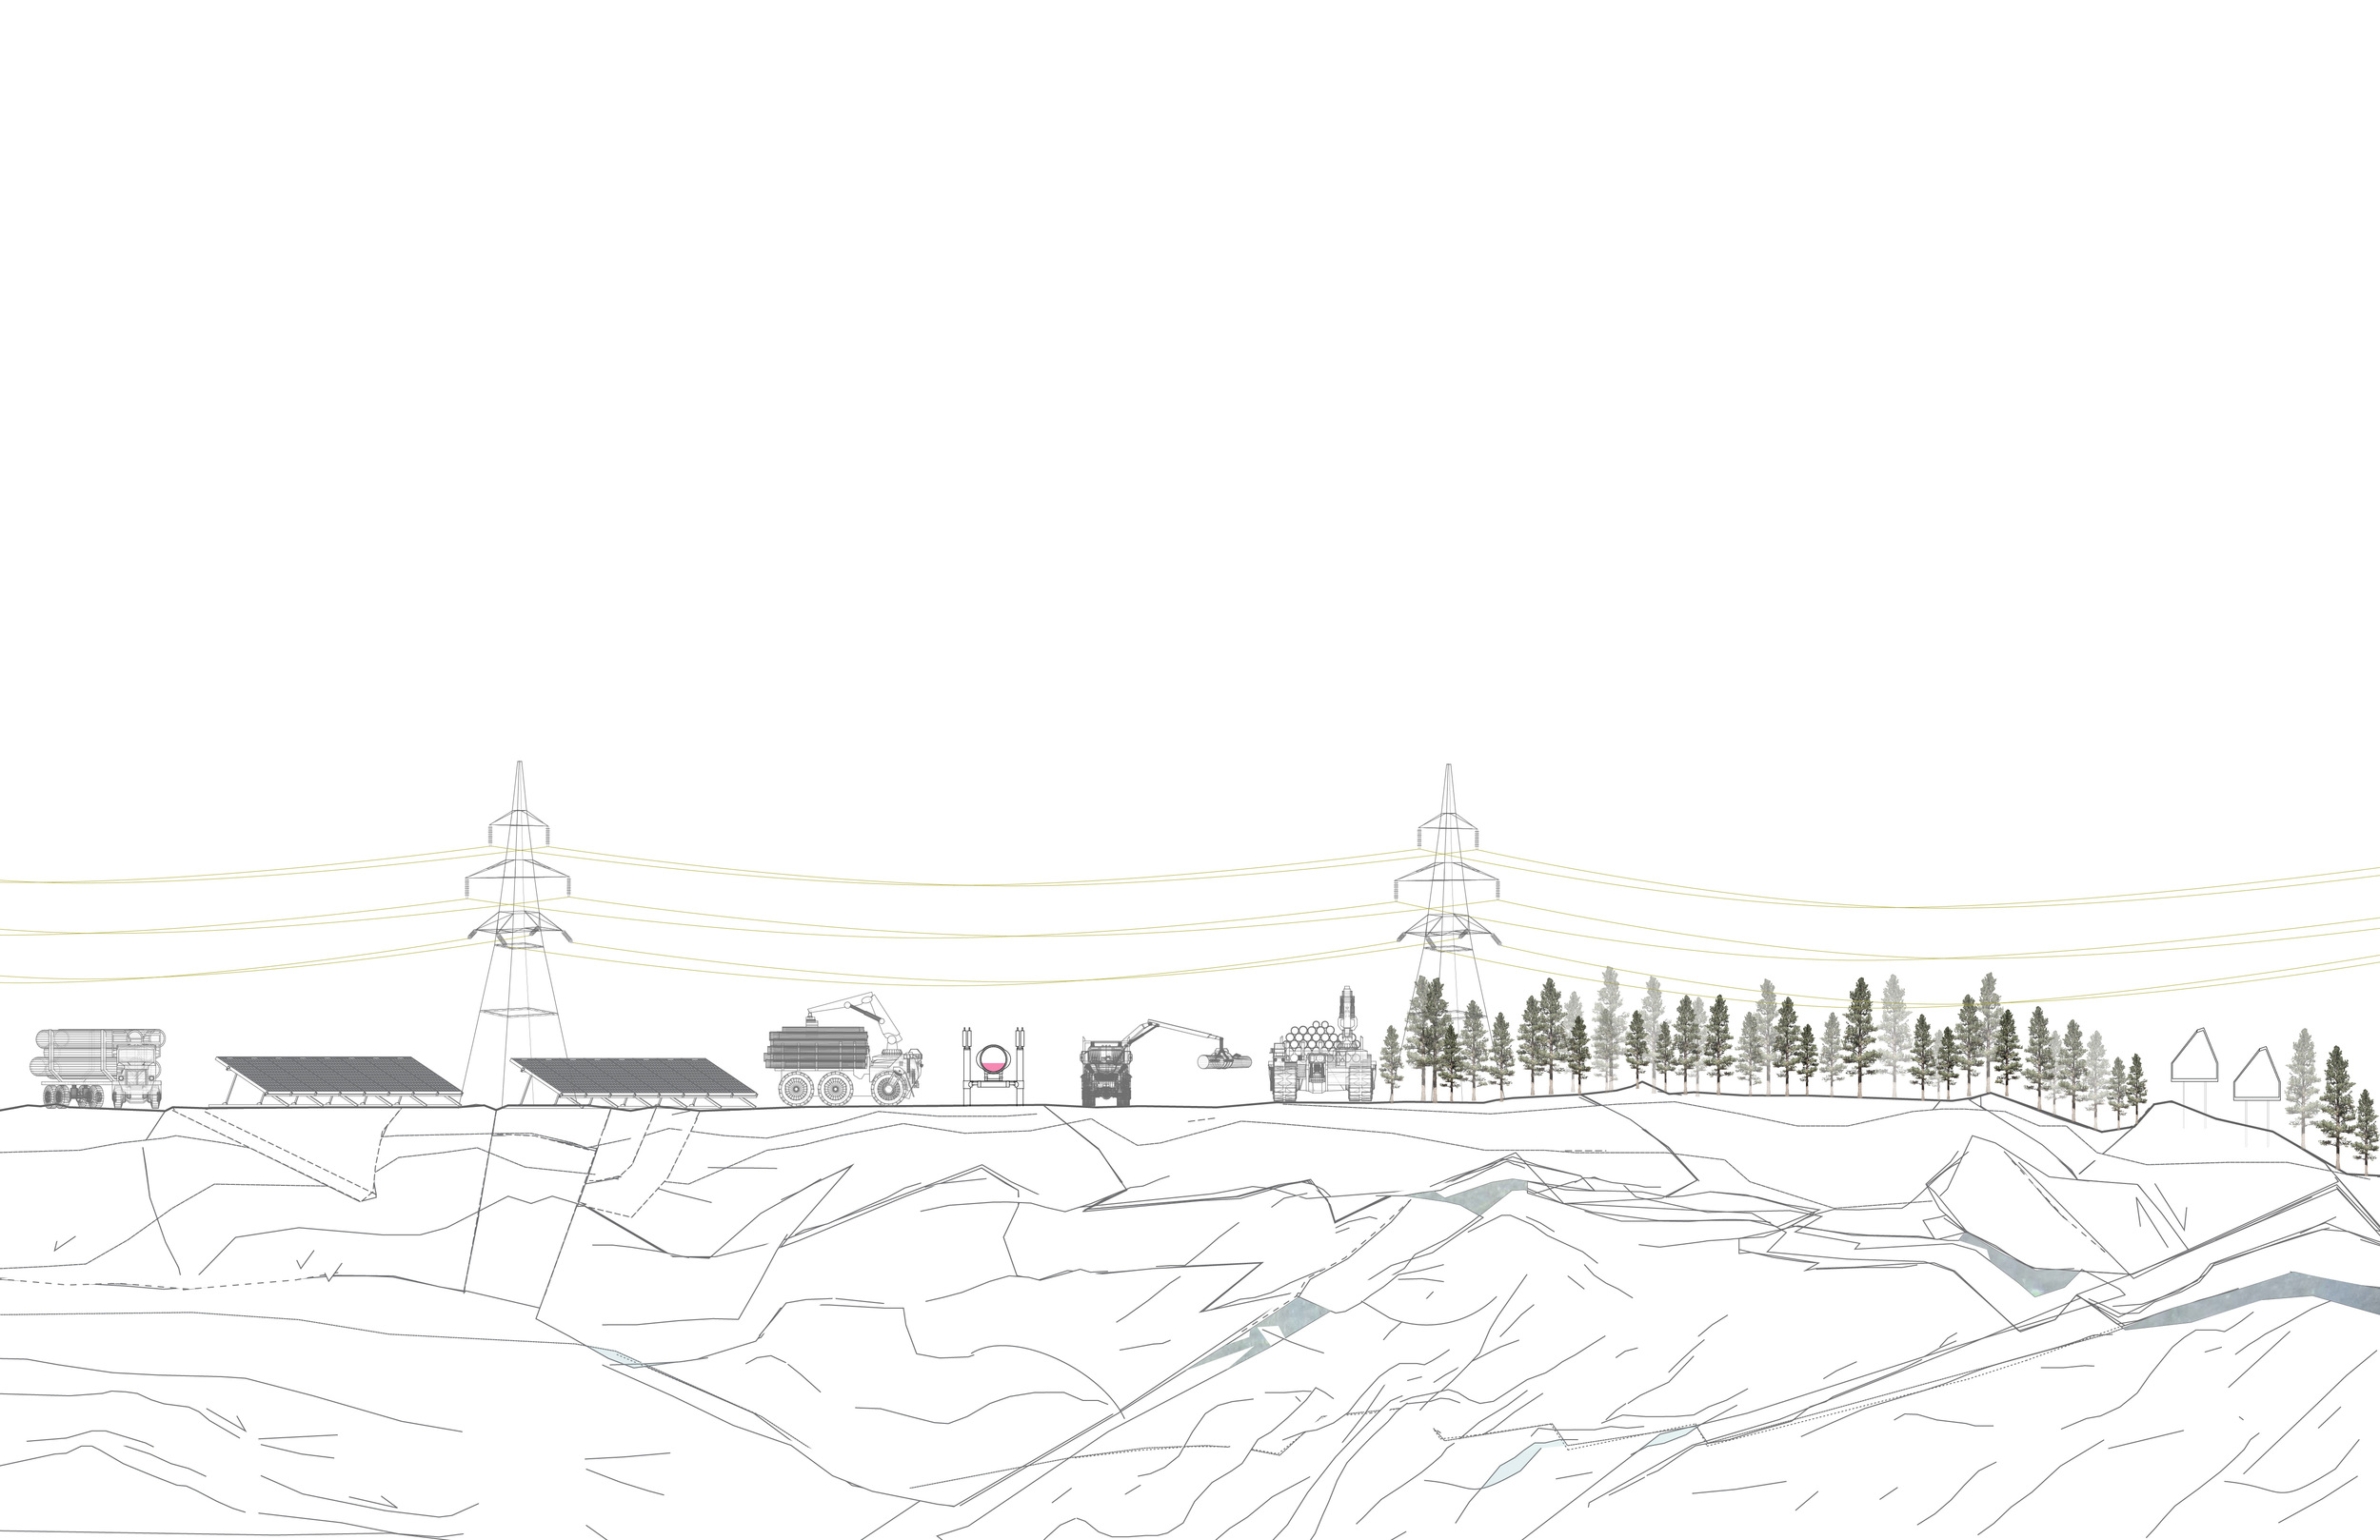
Fairbanks Camp
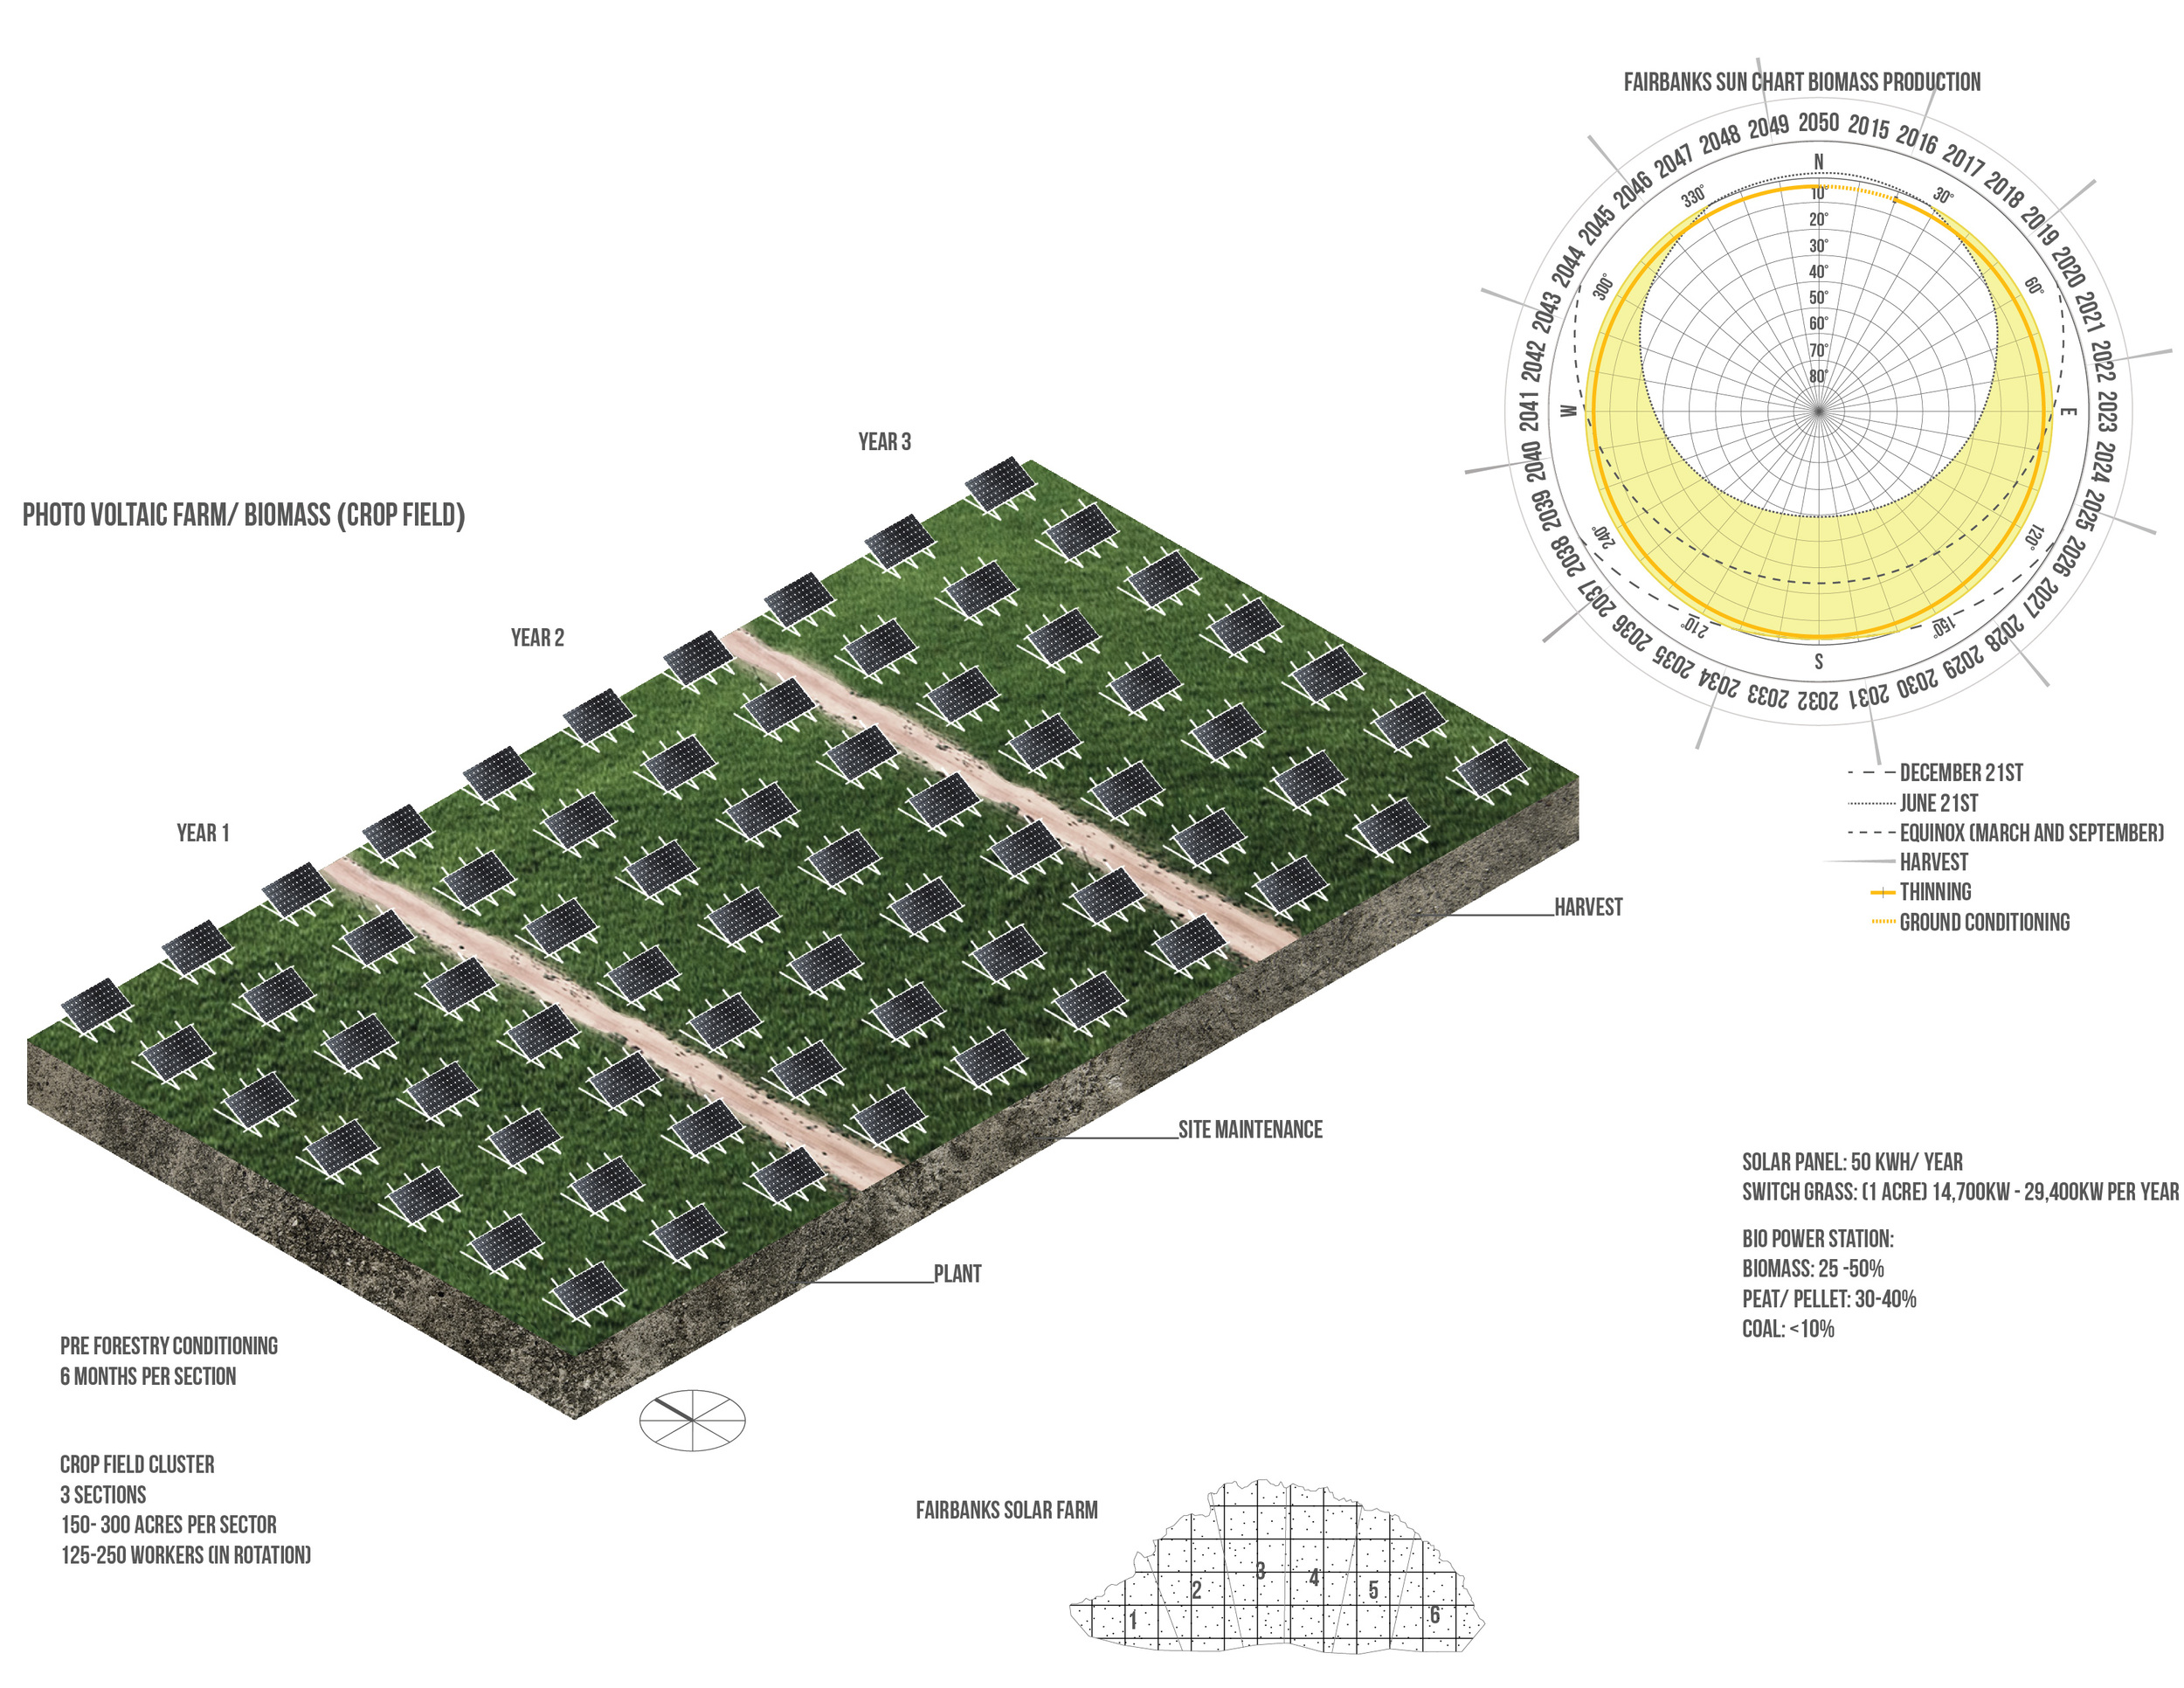
Fairbanks Local Solar Renewable Energy Operations
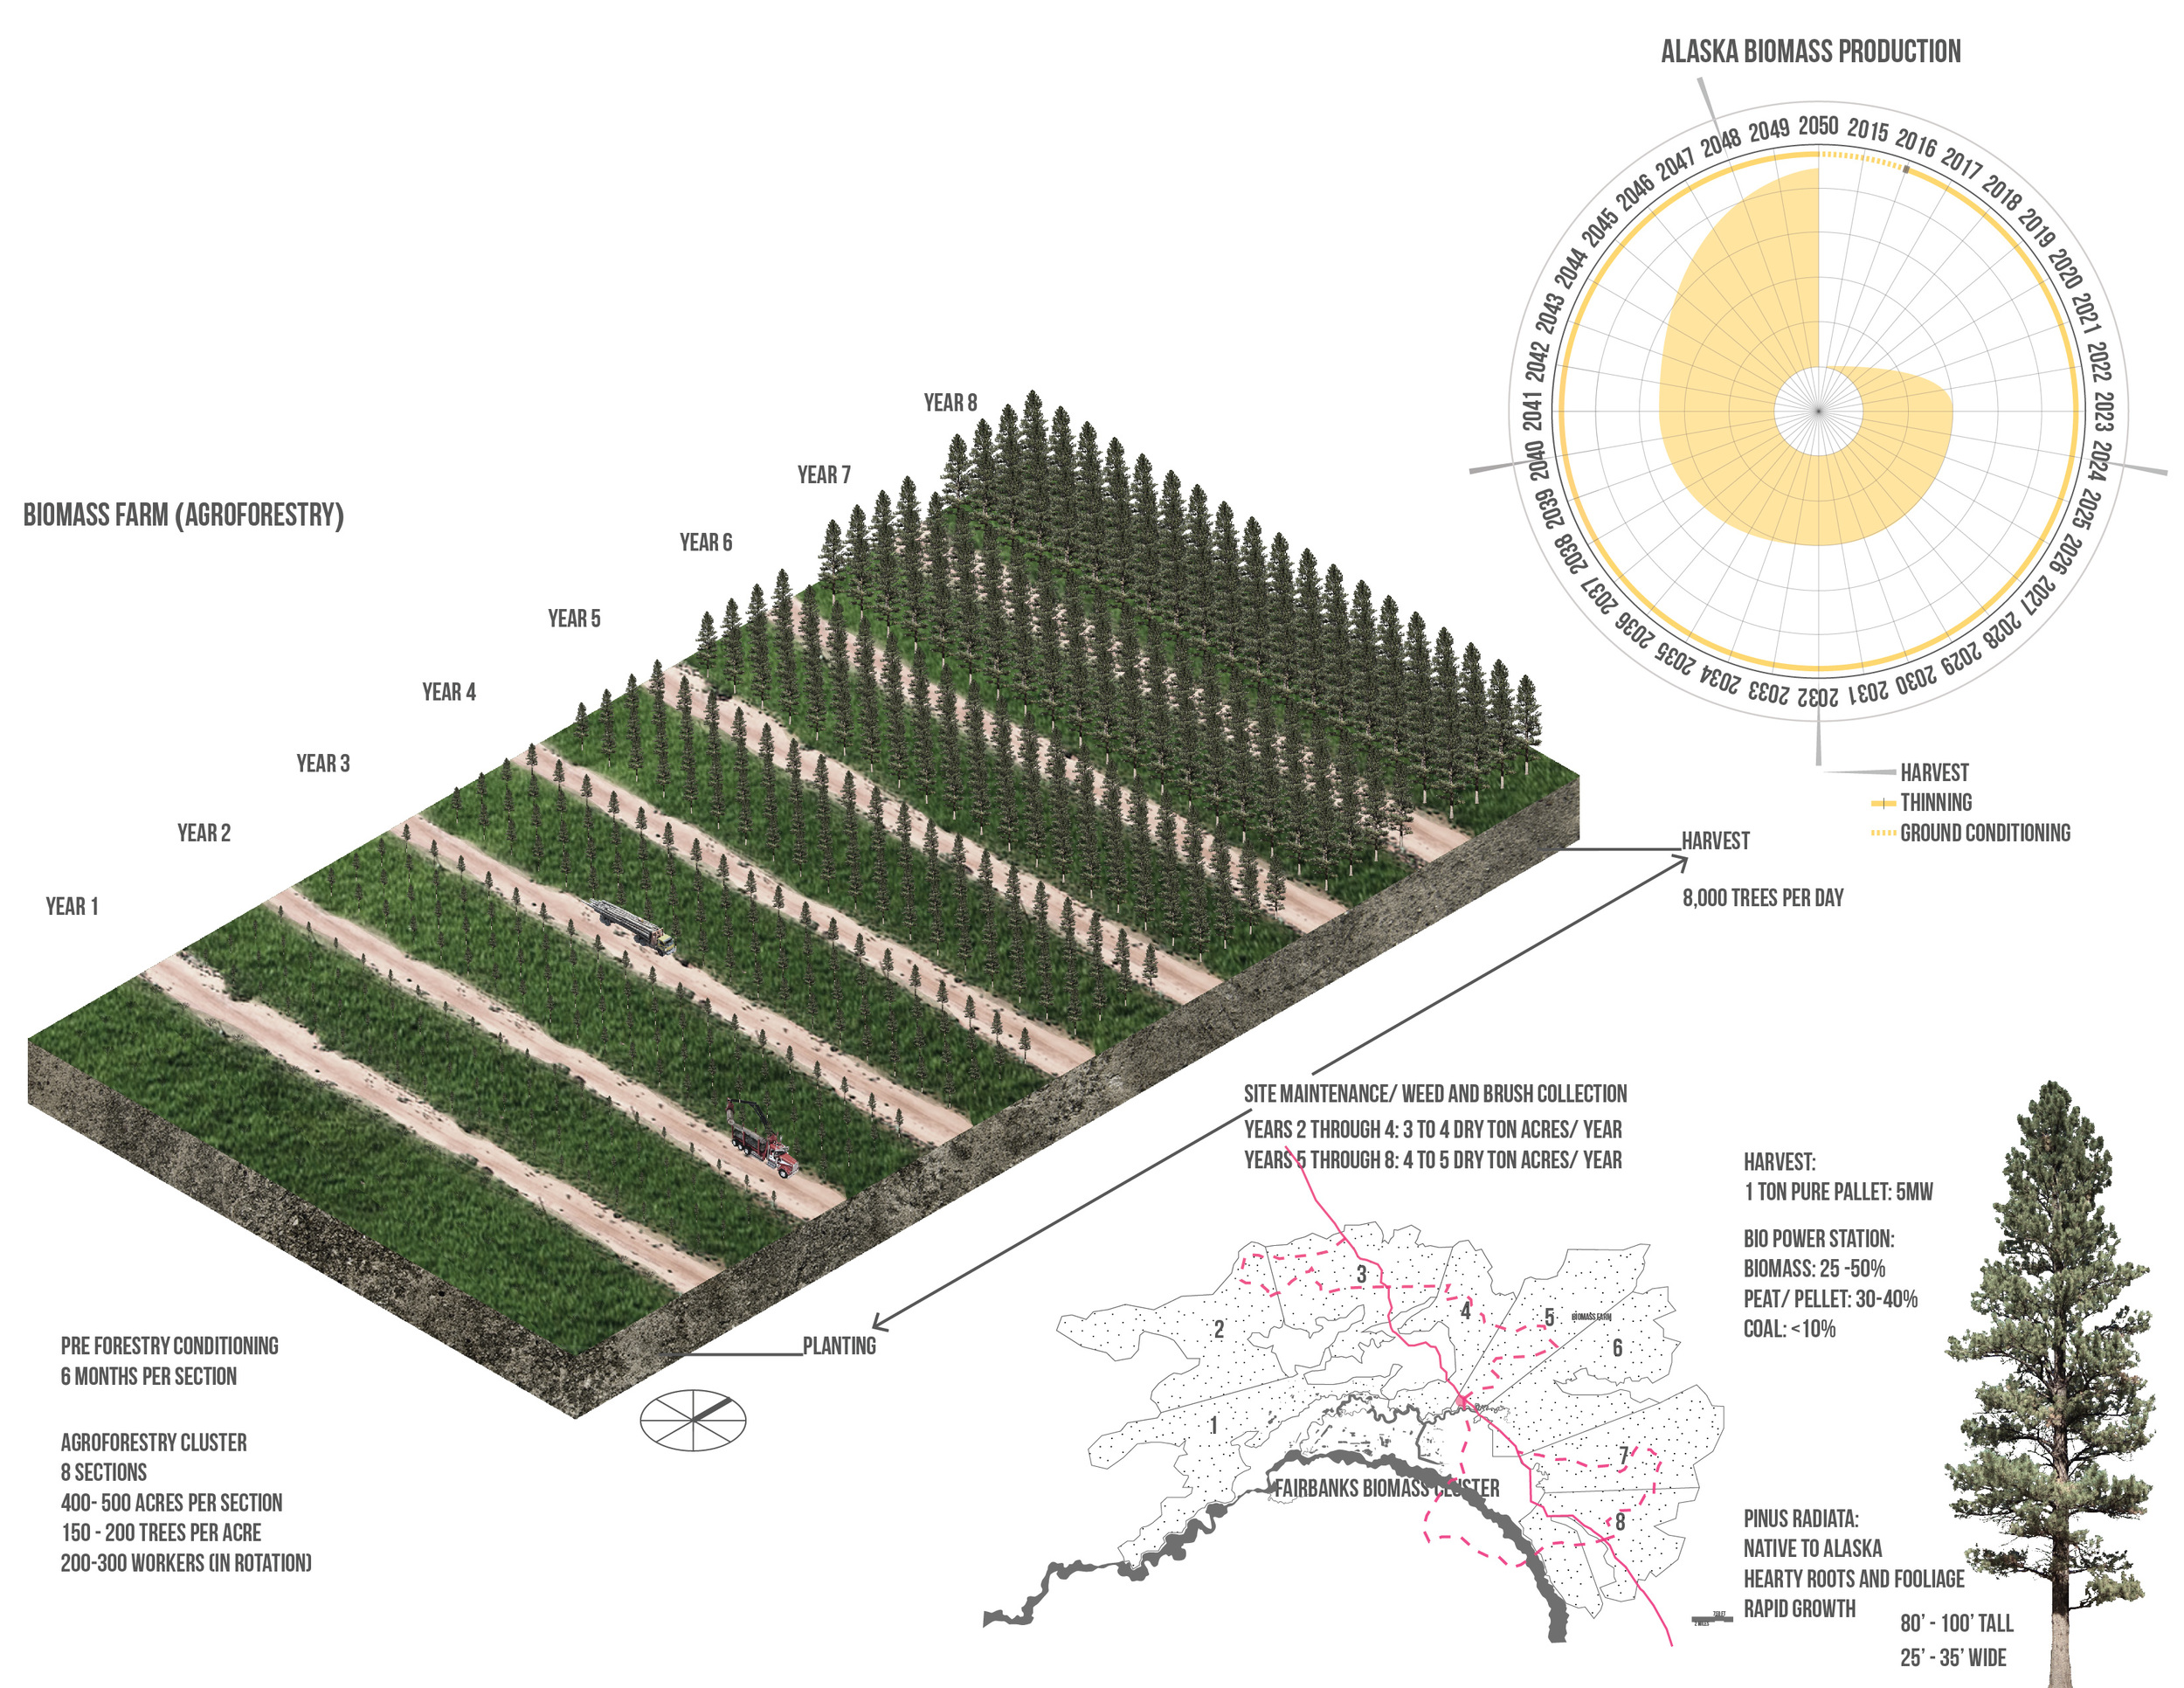
Fairbanks local Biomass Renewable Energy Operations

Fairbanks, Alaska 2050
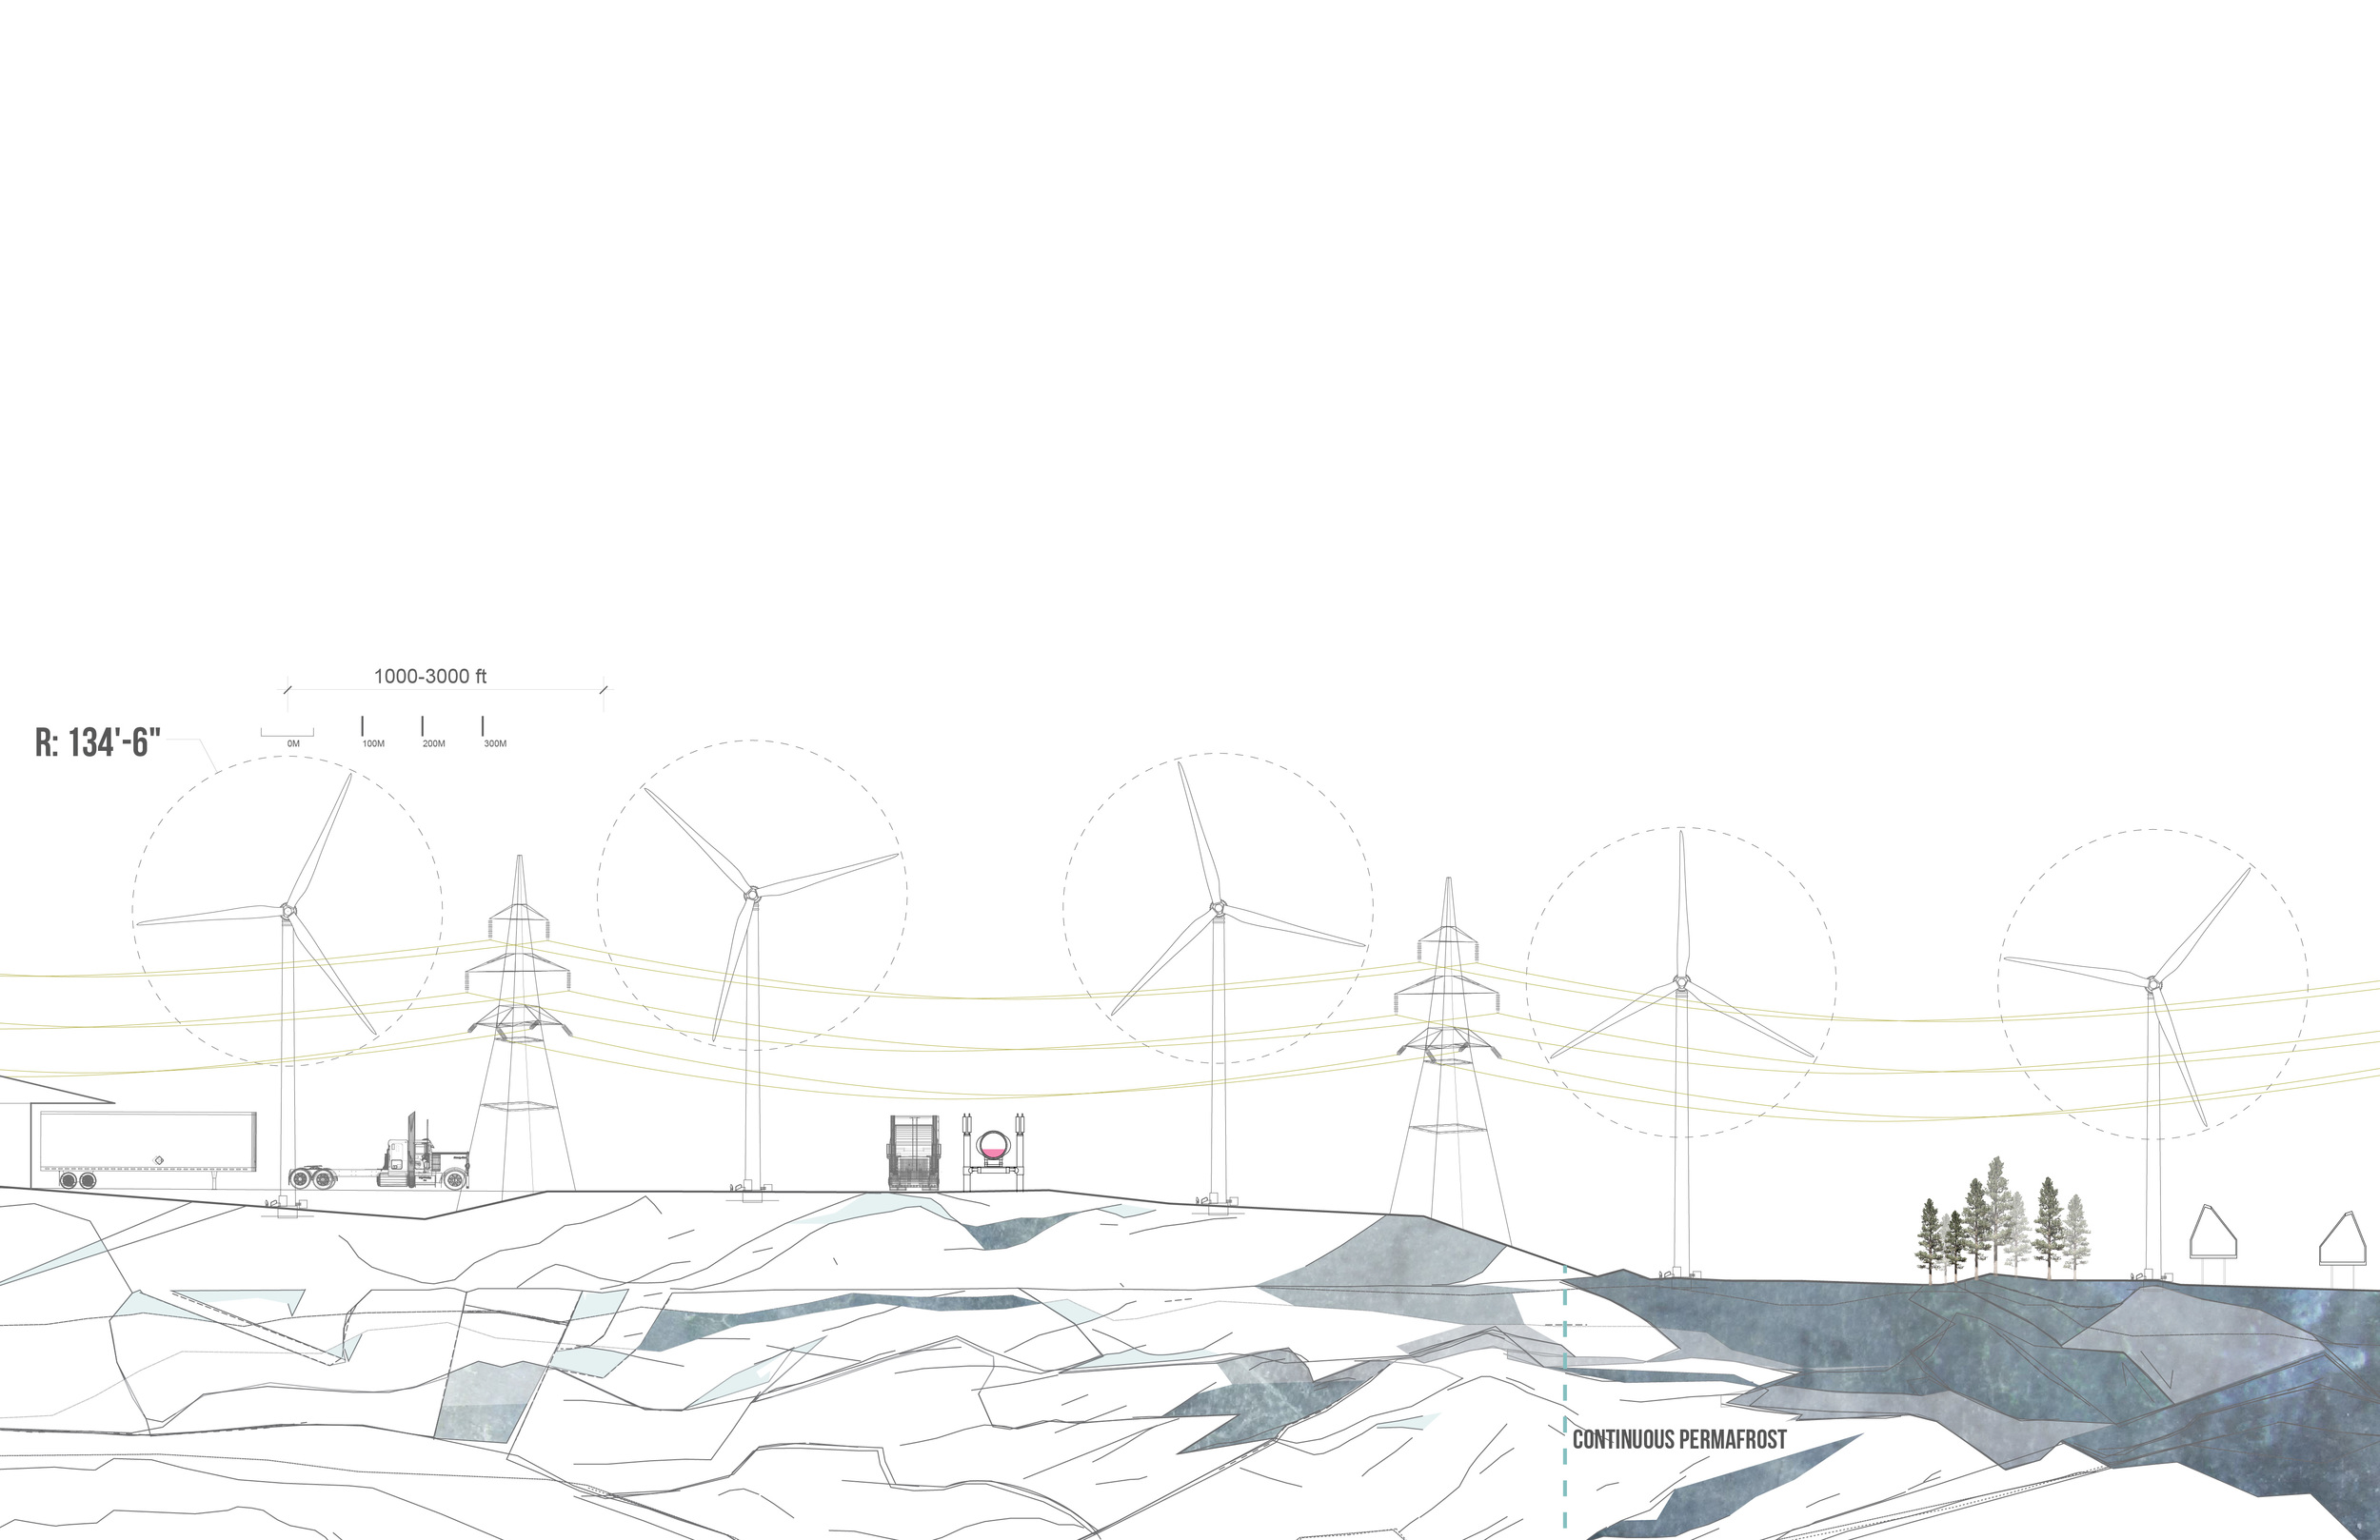
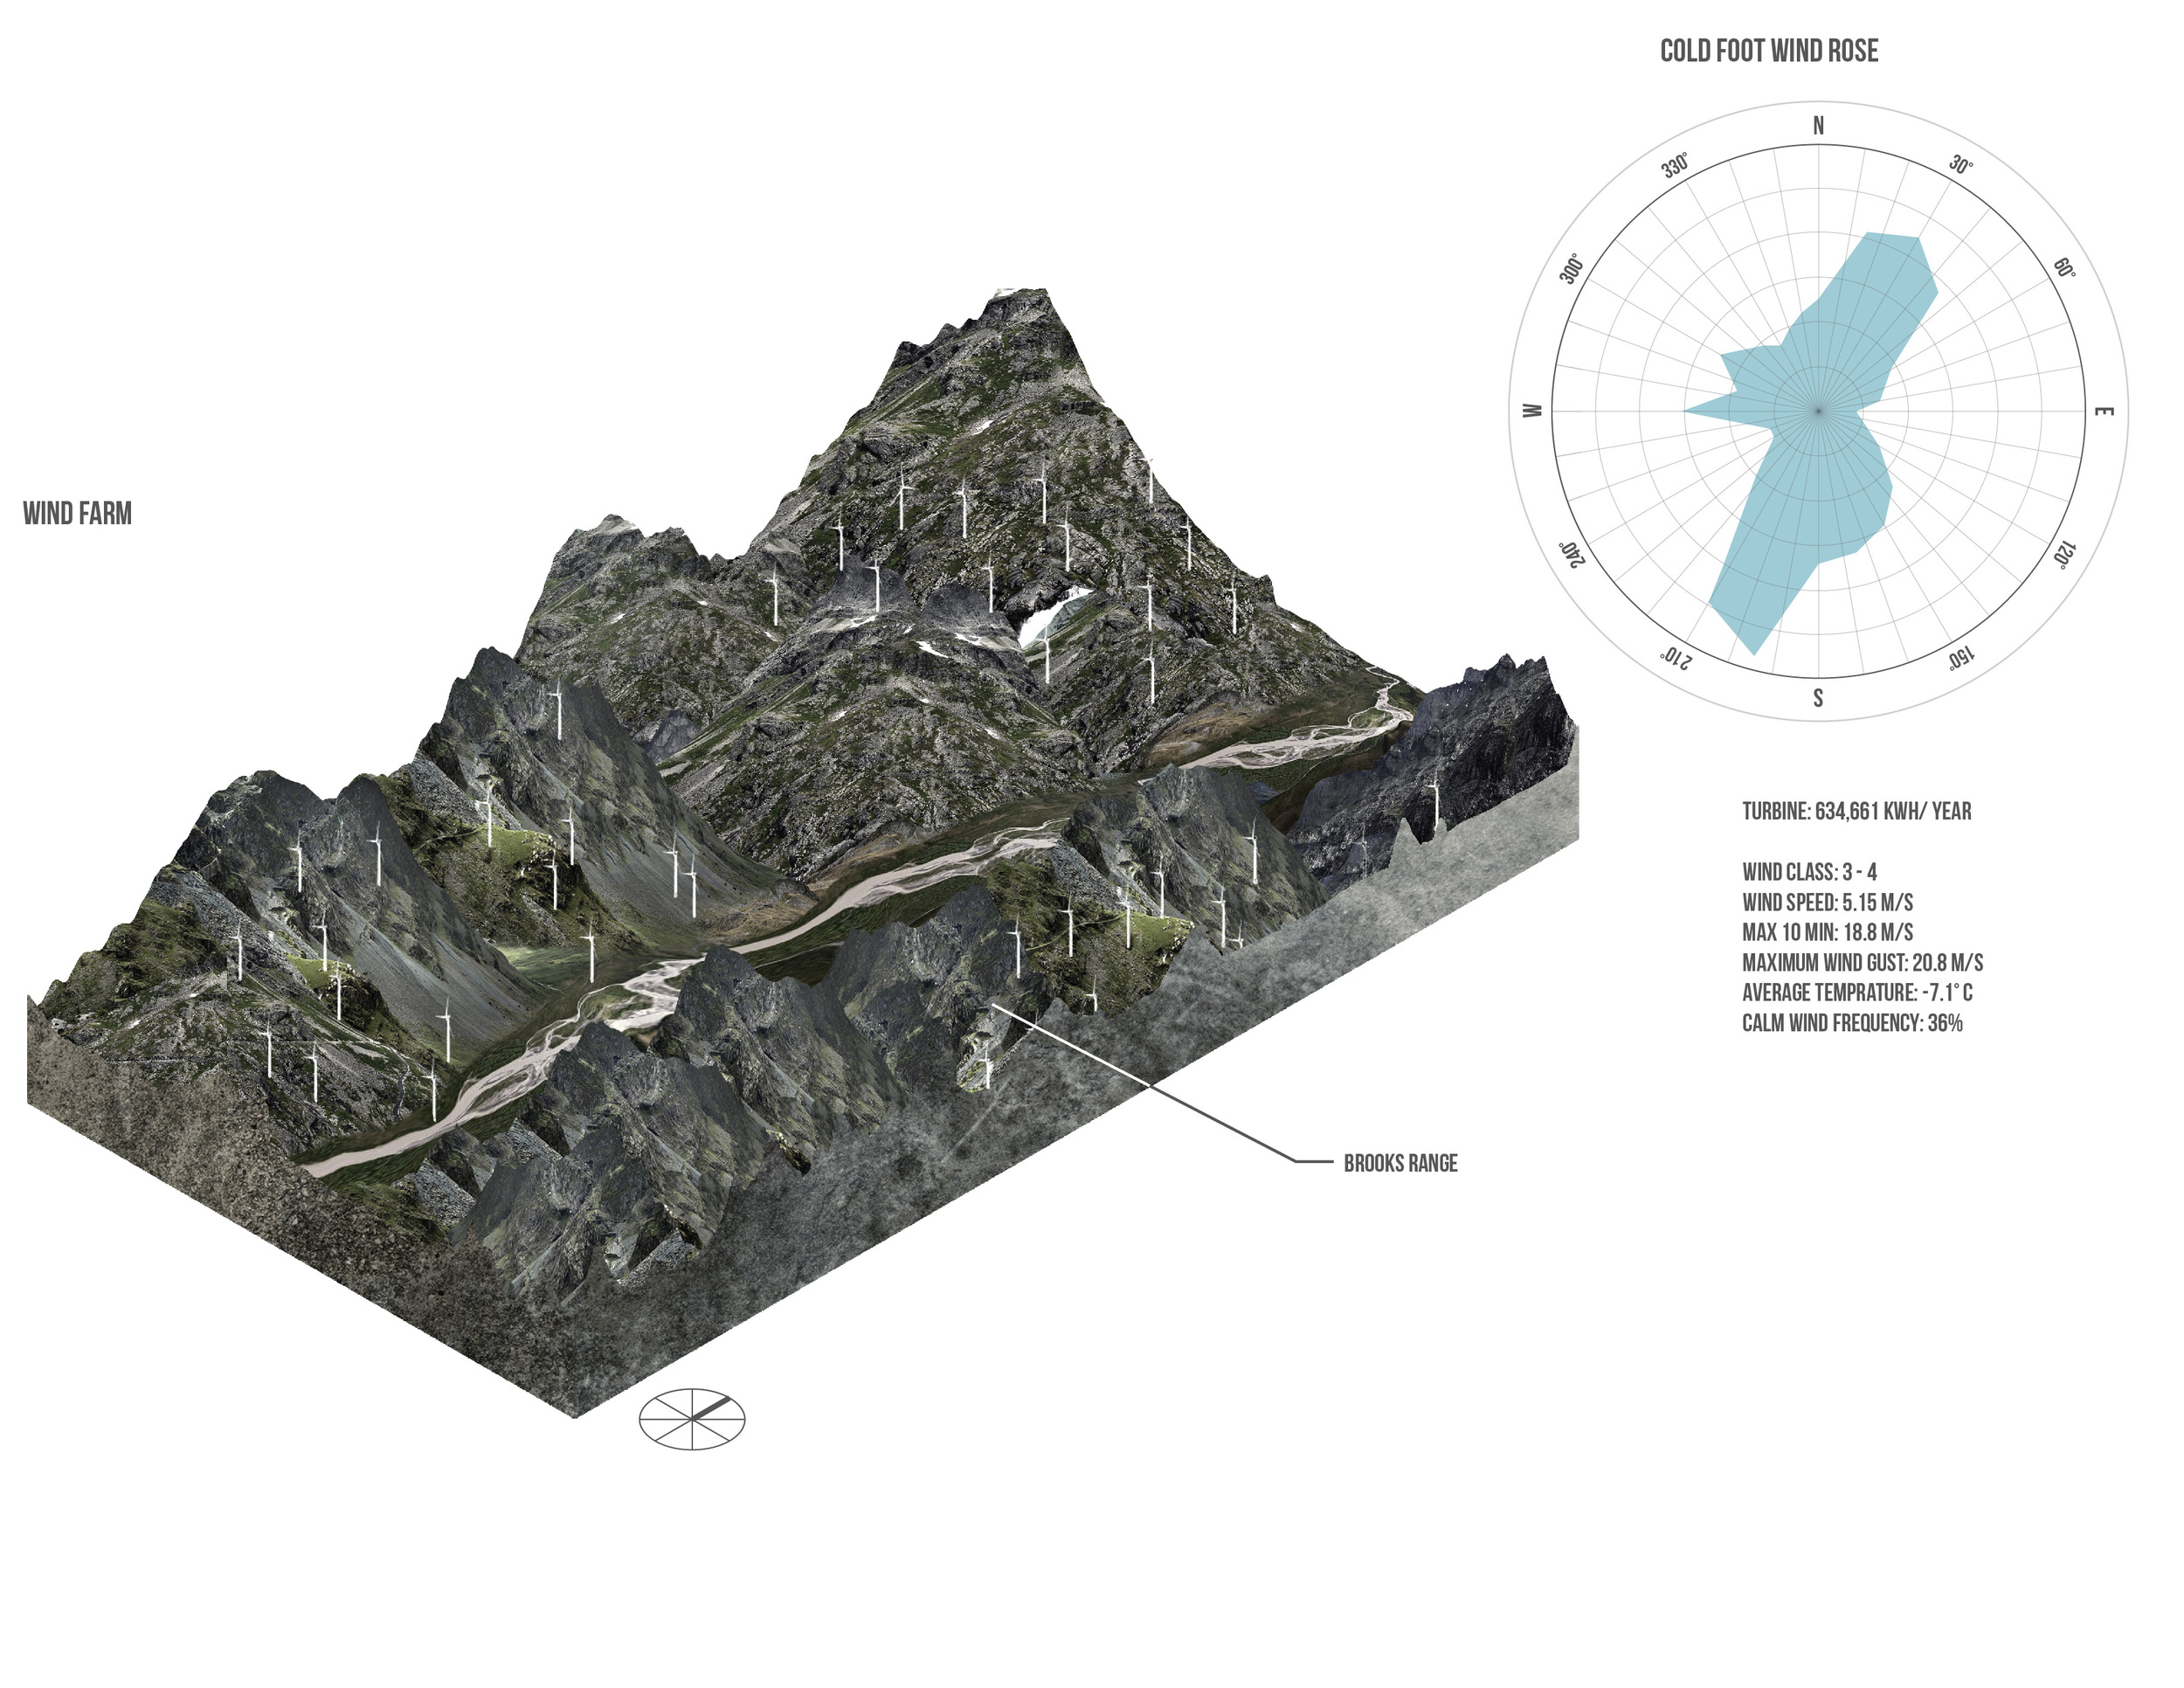
Coldfoot 2012
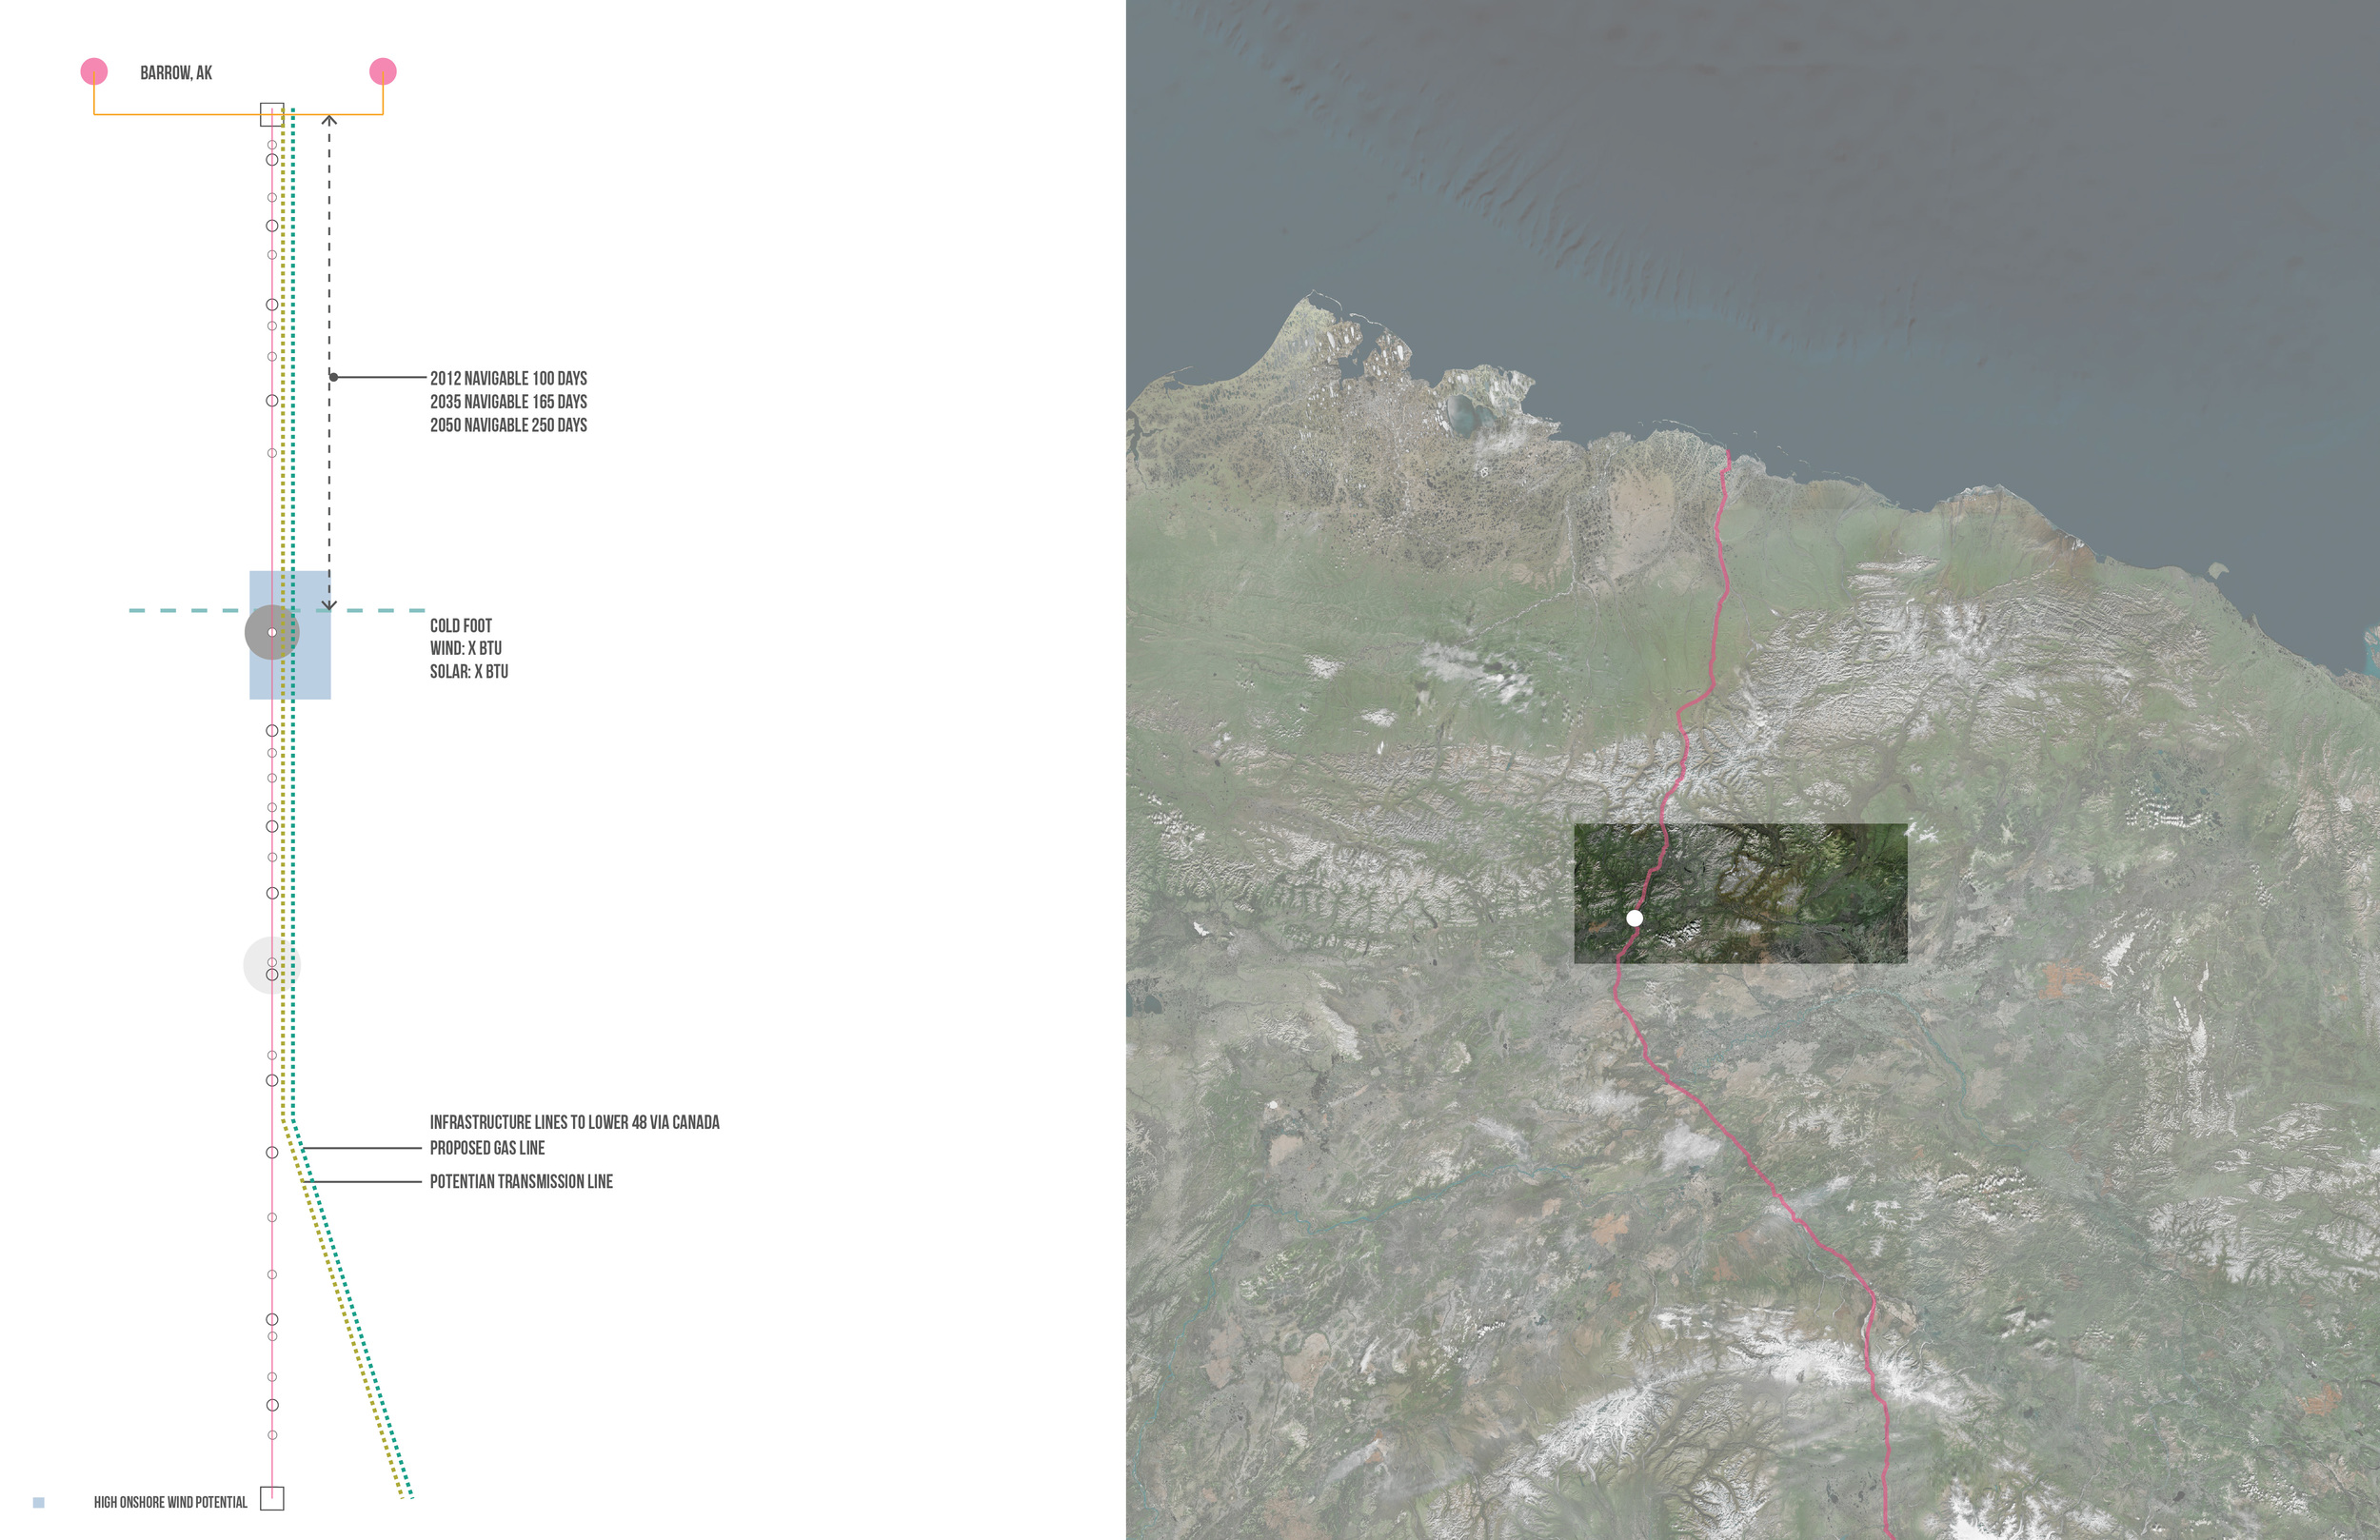
The Coldfoot Camp is 200 miles North of Fairbanks and is positioned at the intersection of fertile ground and the continuous permafrost zone. This is a strategic location for the Trans-Alaska operations because beyond this node Dalton Highway, the supply road for the pipeline system, becomes dangerous - especially during the winter months. The existing airfield here serves as a temporary base and transports supply’s to Deadhorse, the terminus of the infrastructure at the Arctic Ocean.
Coldfoot 2015
When offshore oil operations begin the State can take advantage of the onshore wind potentials around Coldfoot.
Coldfoot 2050
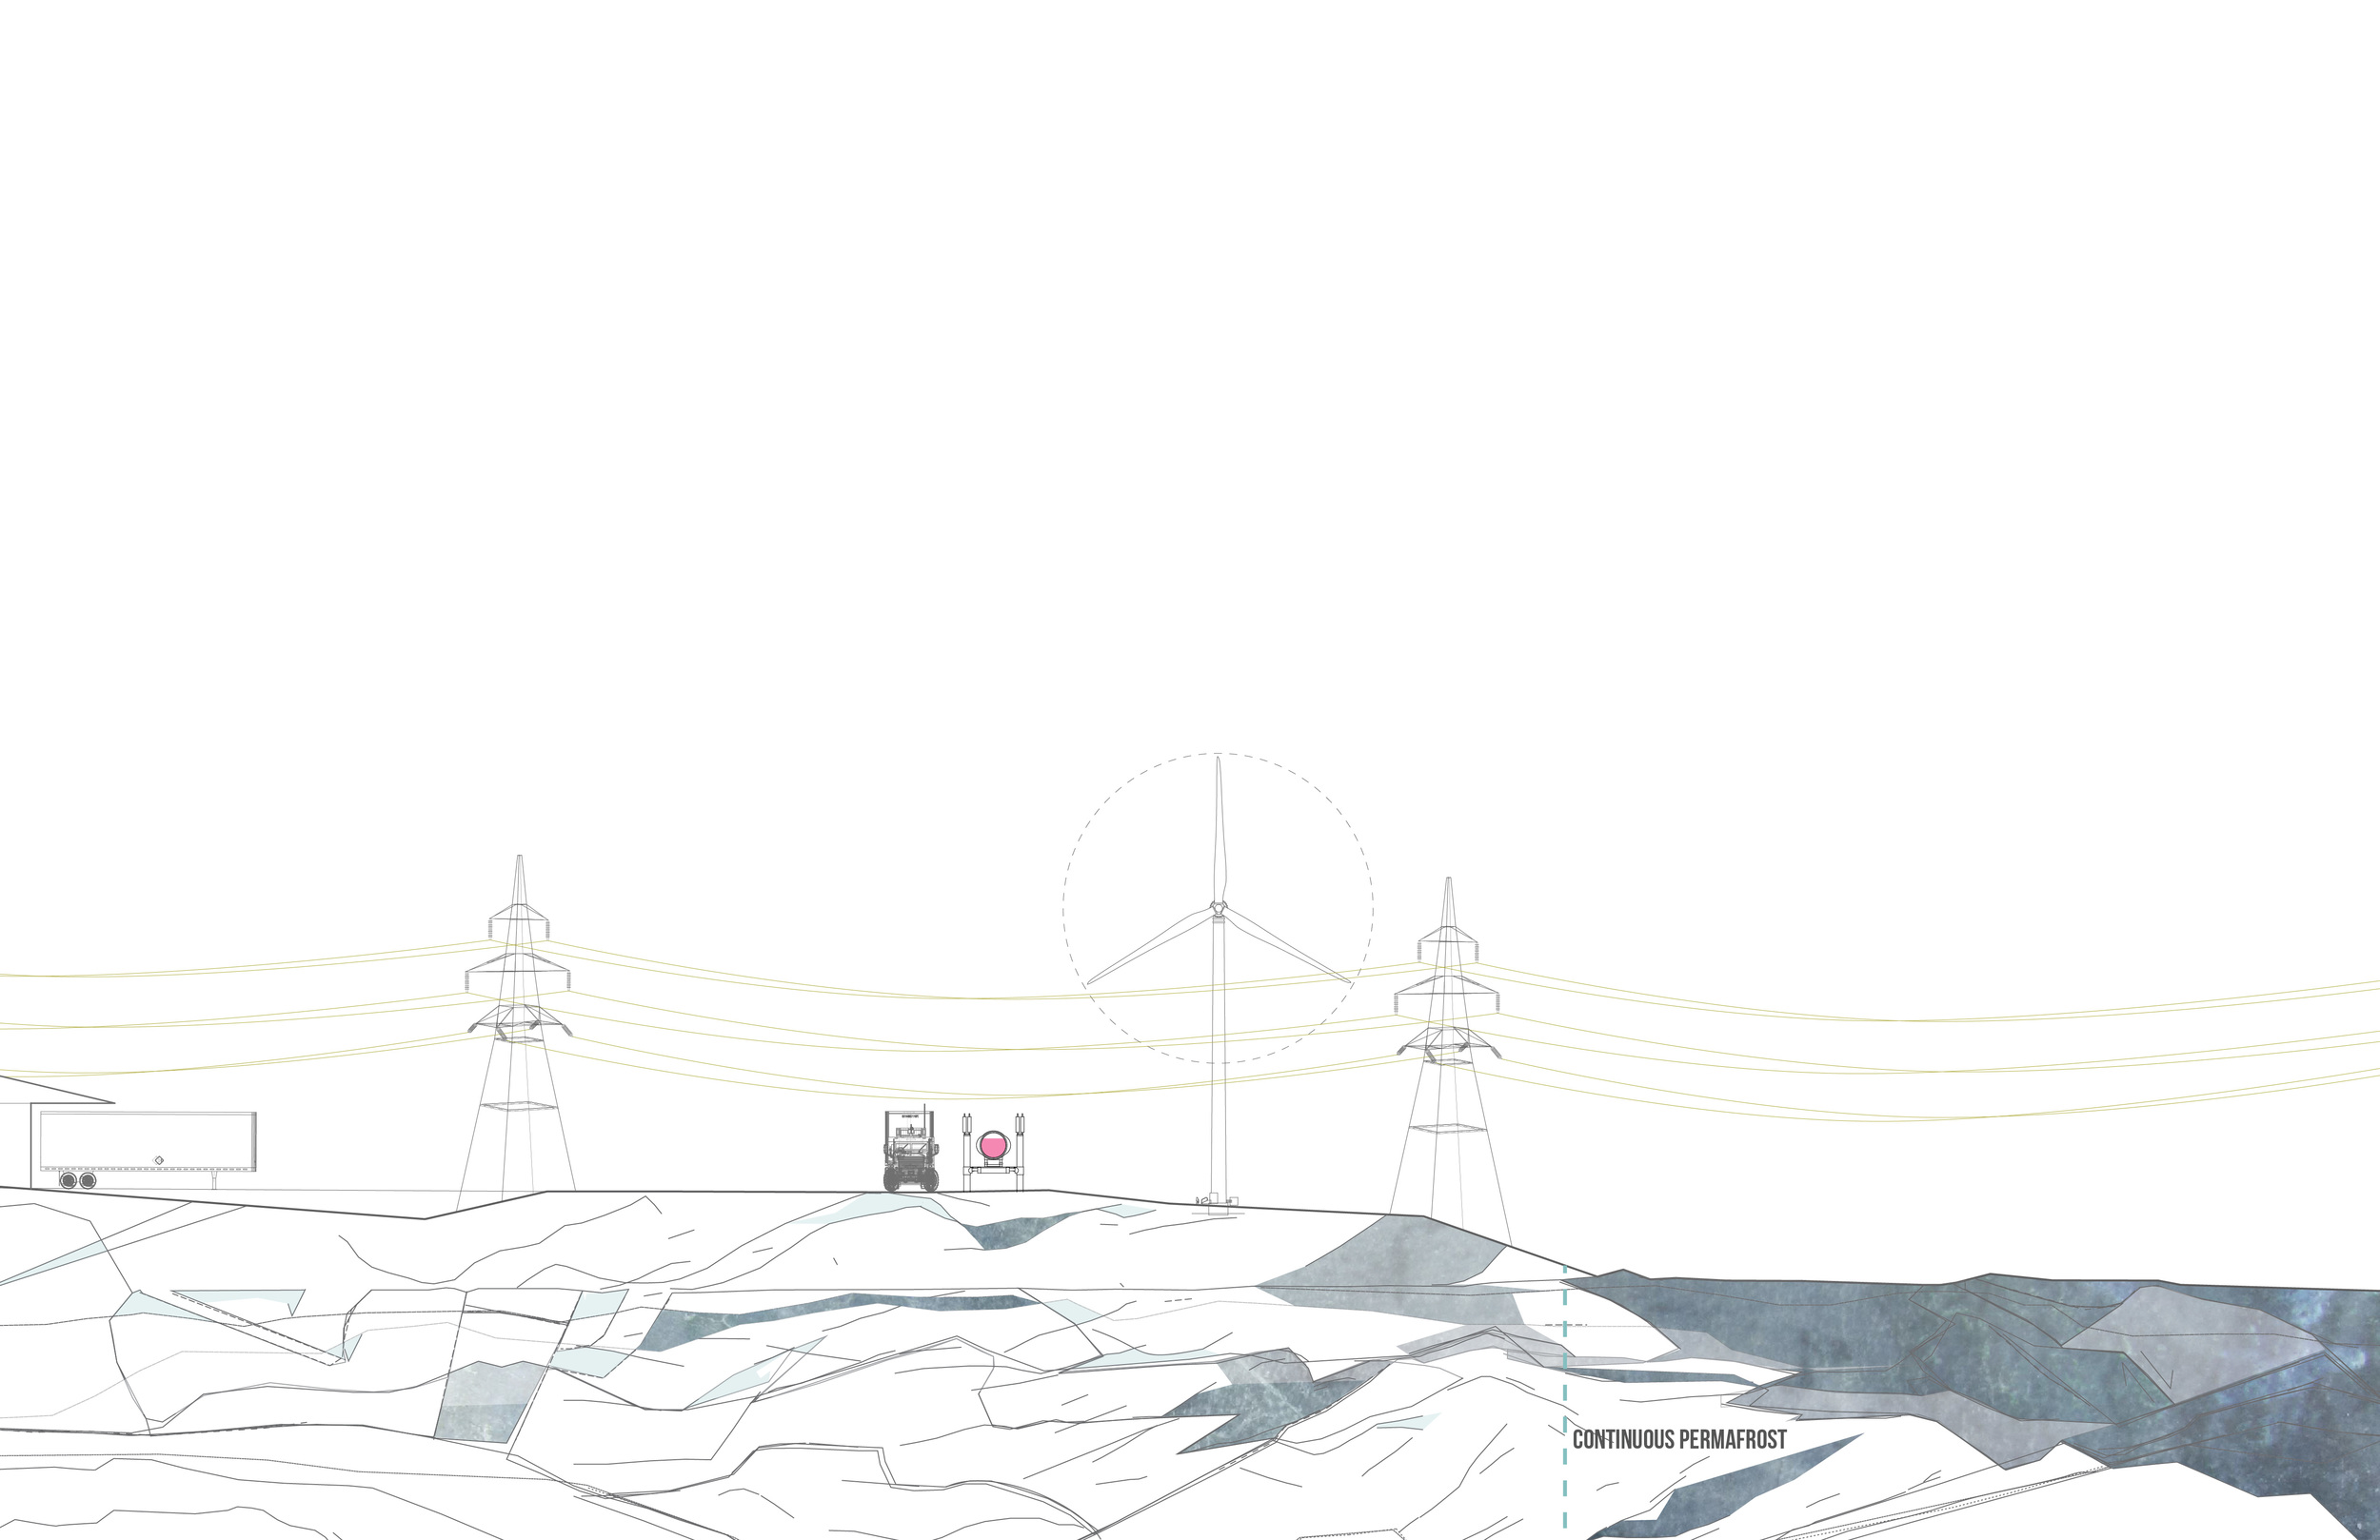
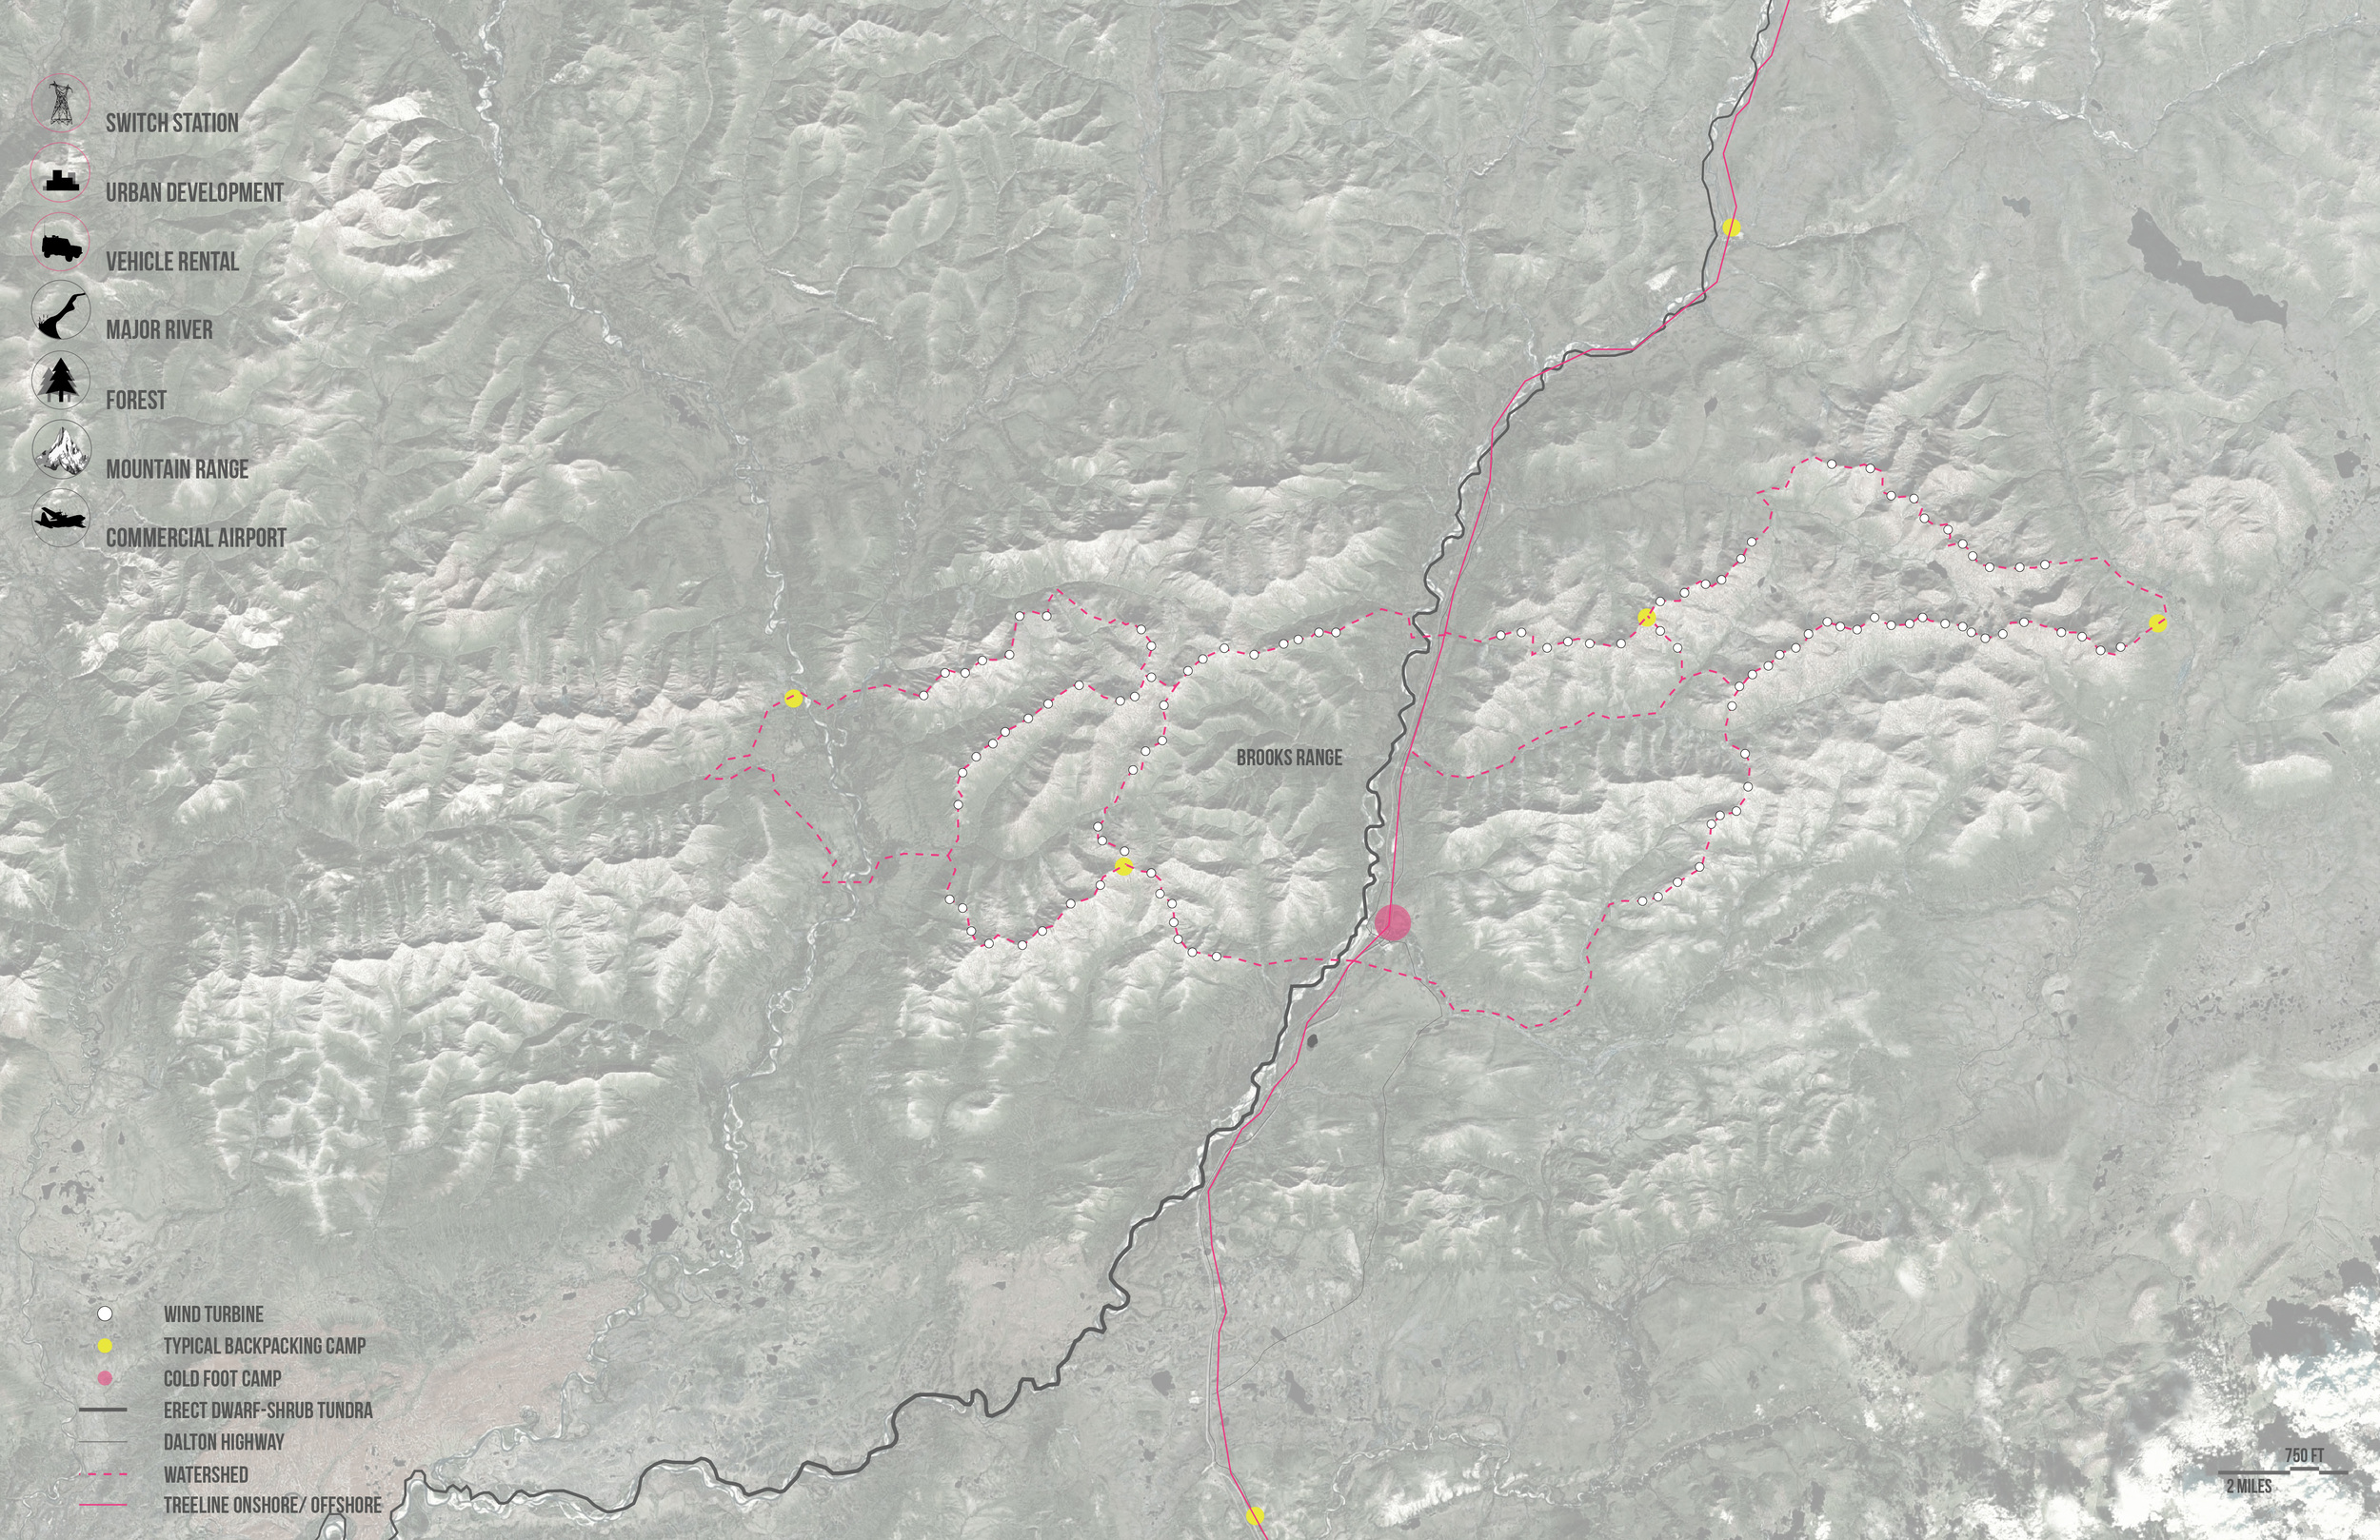
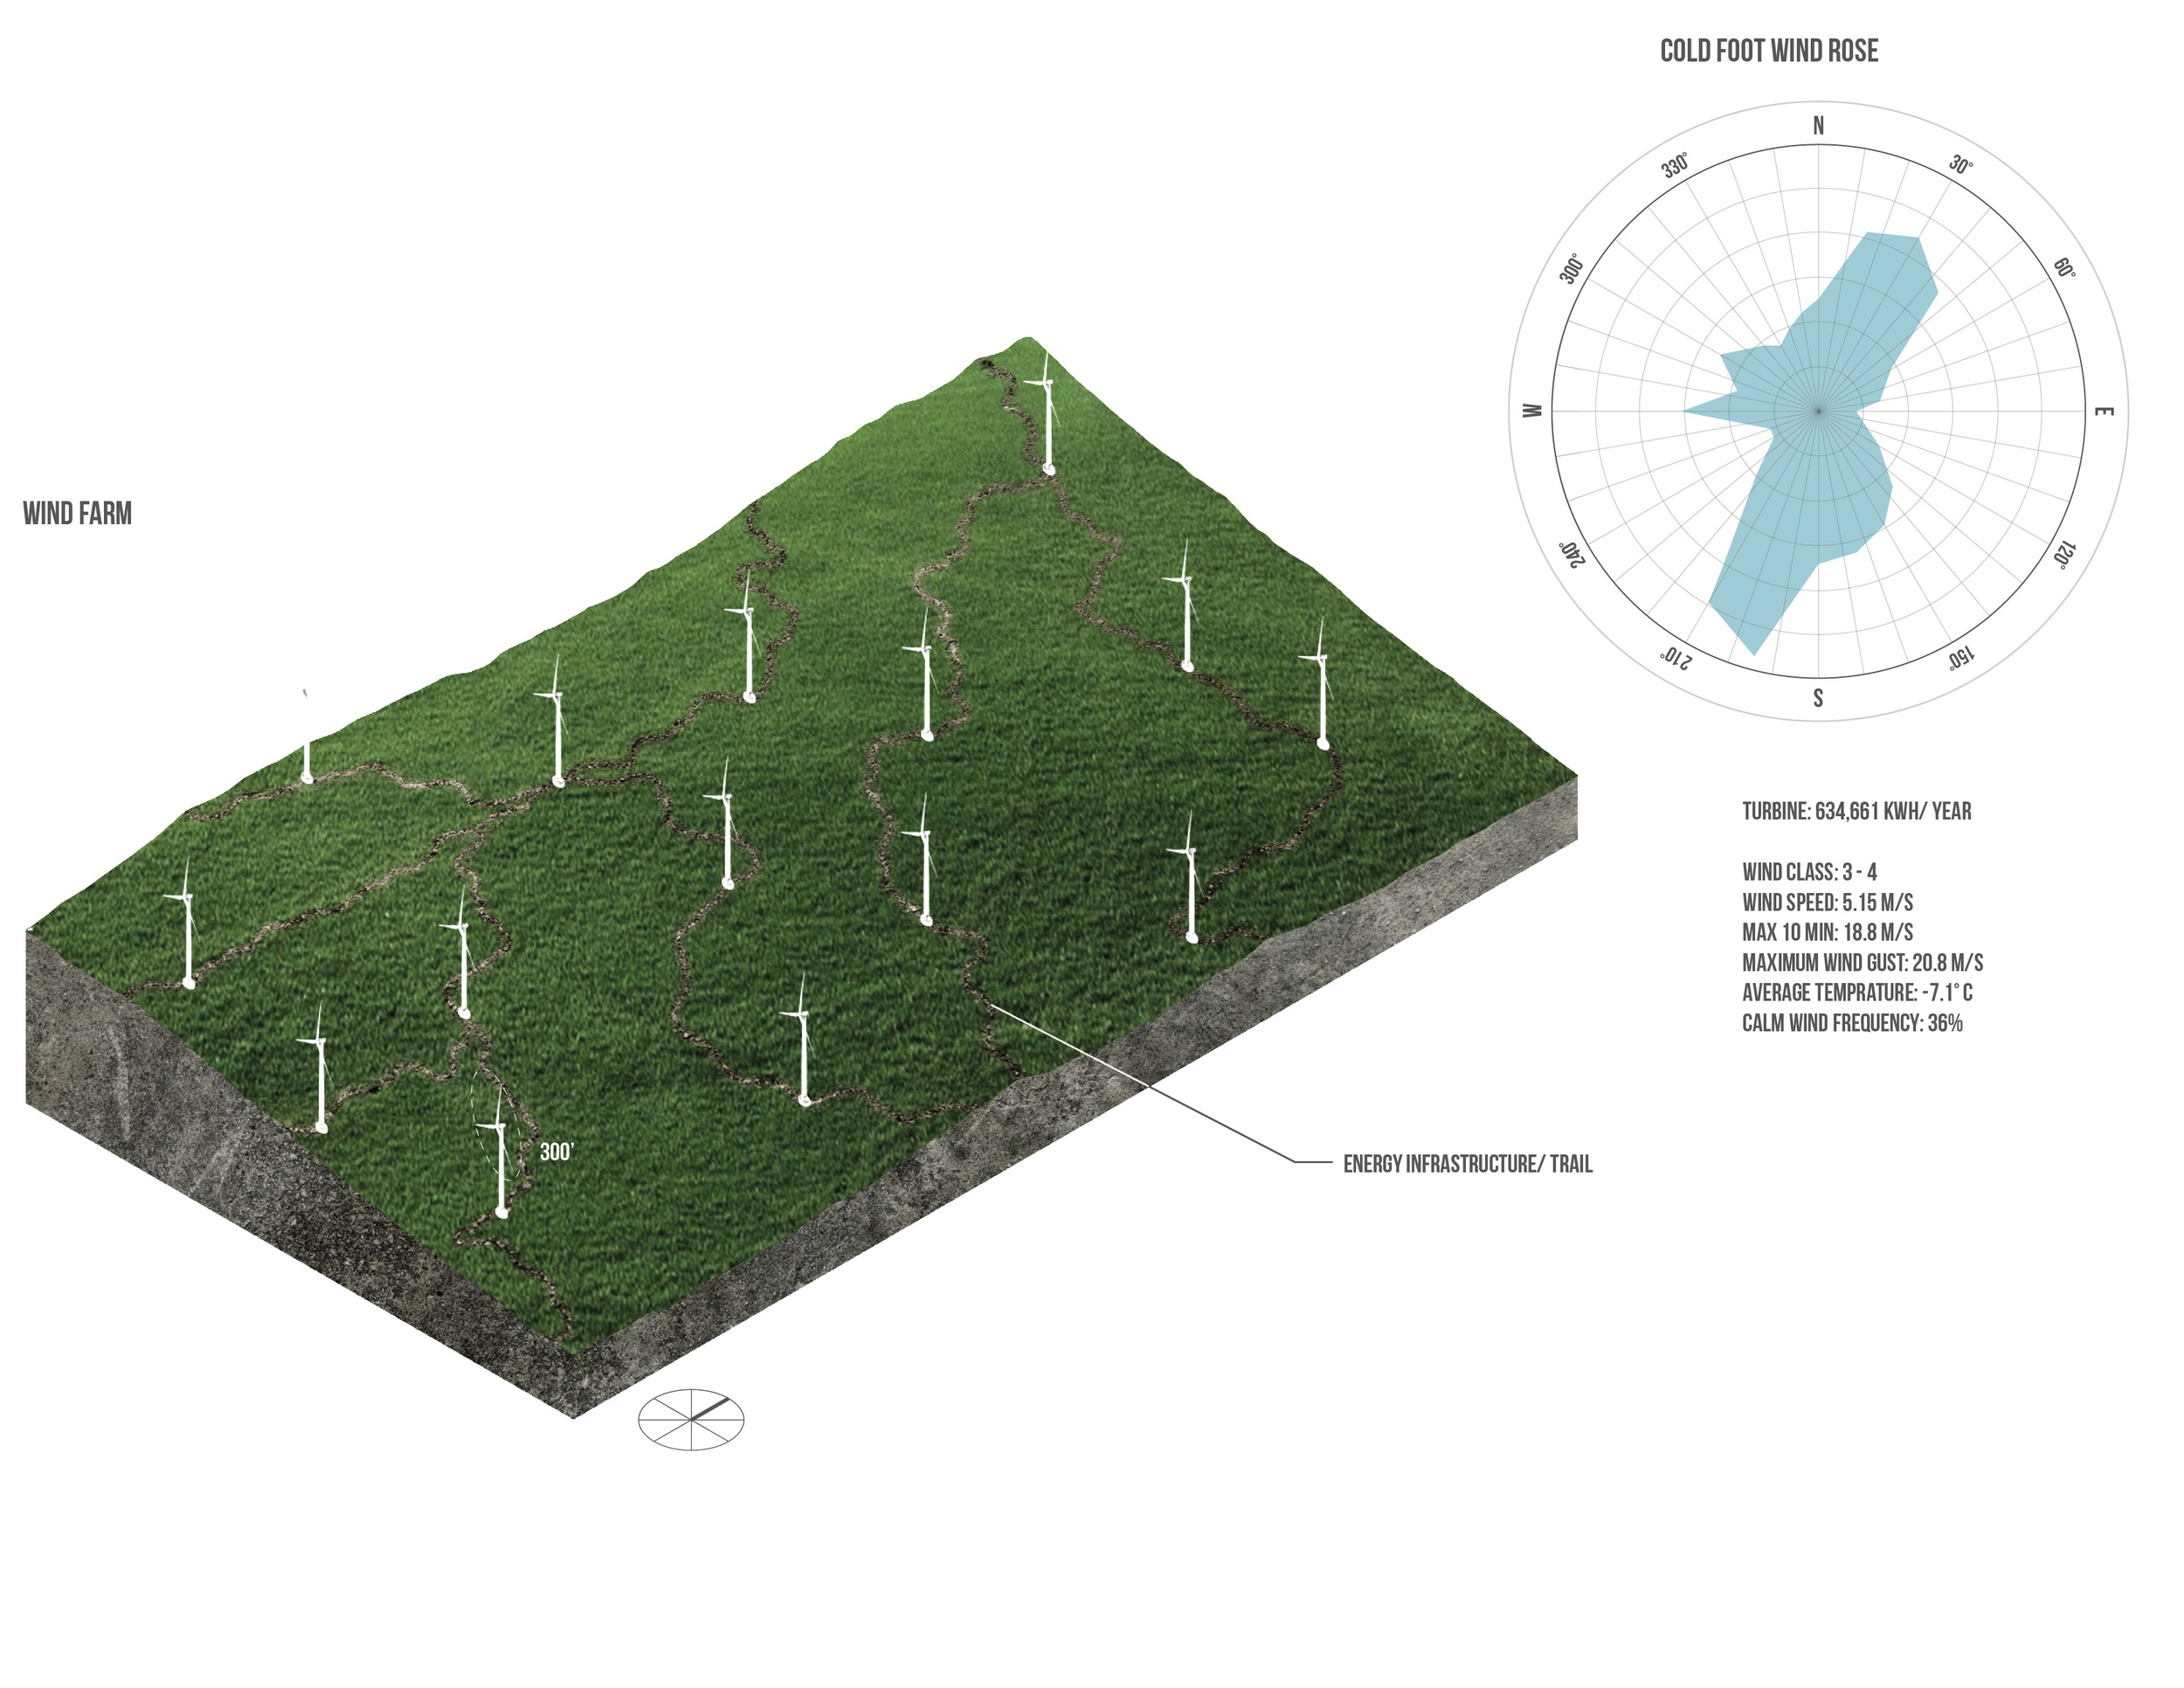
Building out the wind farm will take several years. Both, during and after the installation of the turbines the paths created to construct the machines can be utilized as routes for tourists looking to hike, bike, hunt and explore the Alaskan wilderness.
Coldfoot 2050
The trails created for the turbines, typically along the ridges of Brooks Range, can also host satellite camps for tourists.
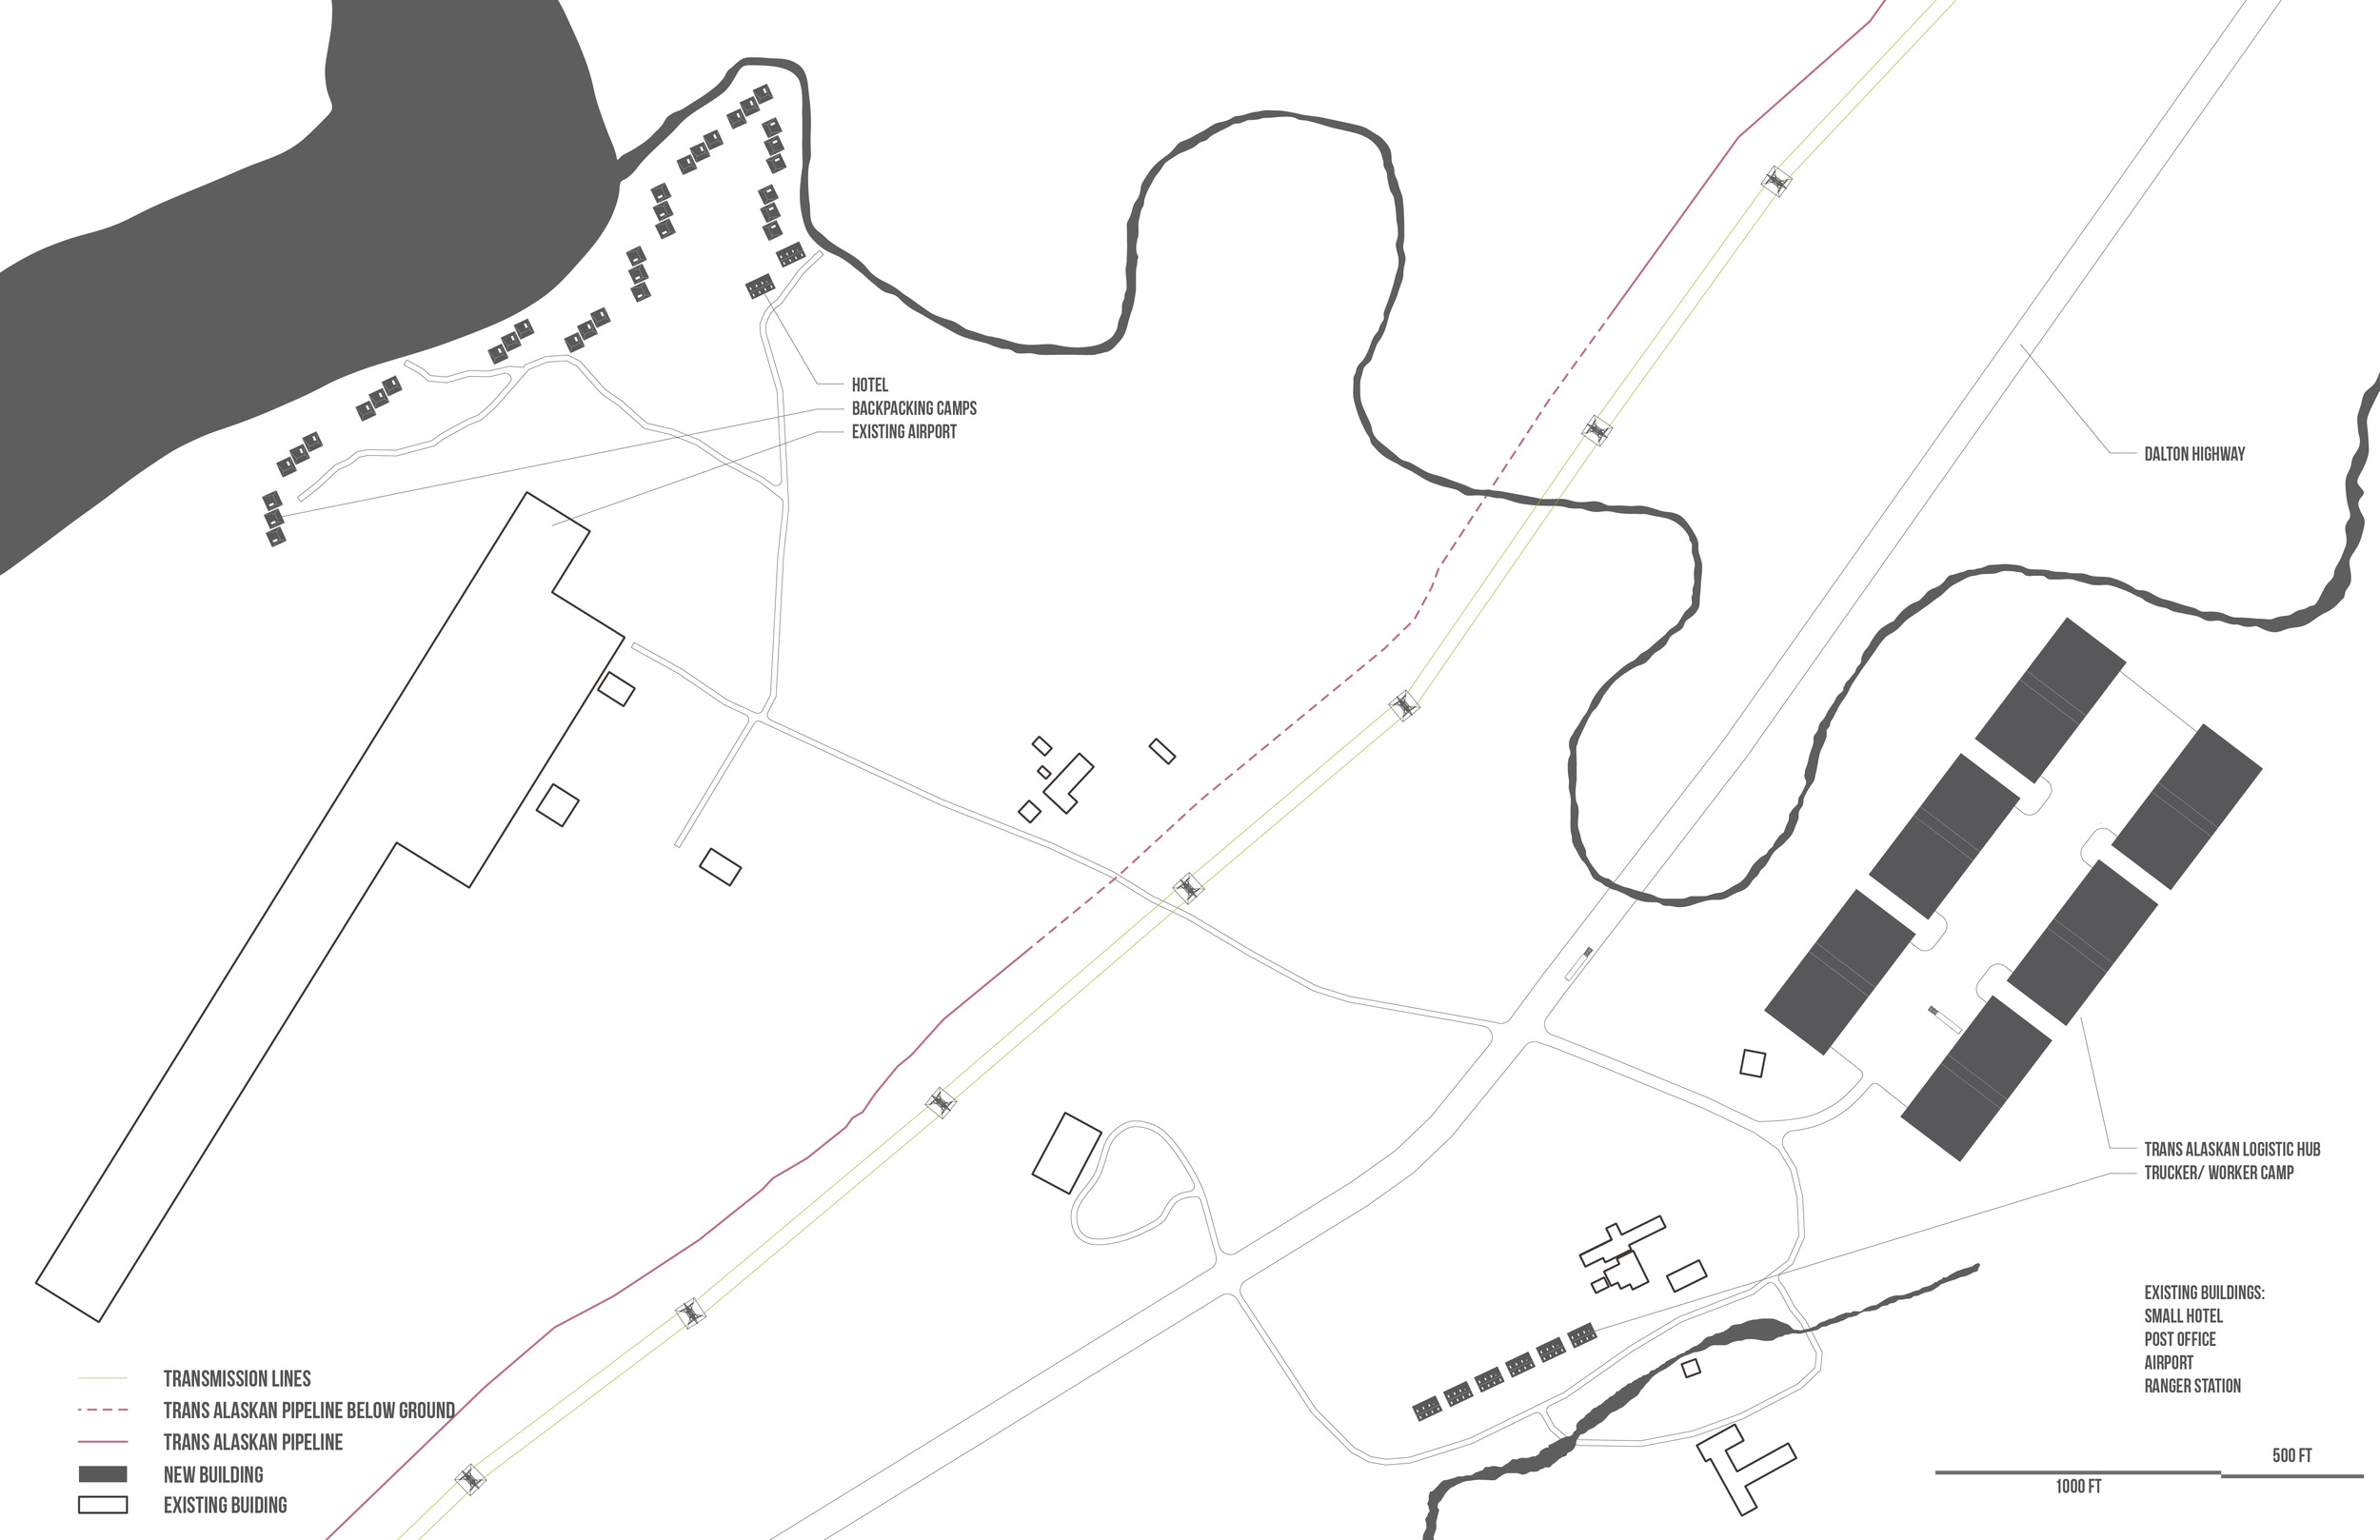
Coldfoot Camp
Coldfoot Renewable Energy Operations Local
Coldfoot Renewable Energy Operations Regional

Coldfoot 2050
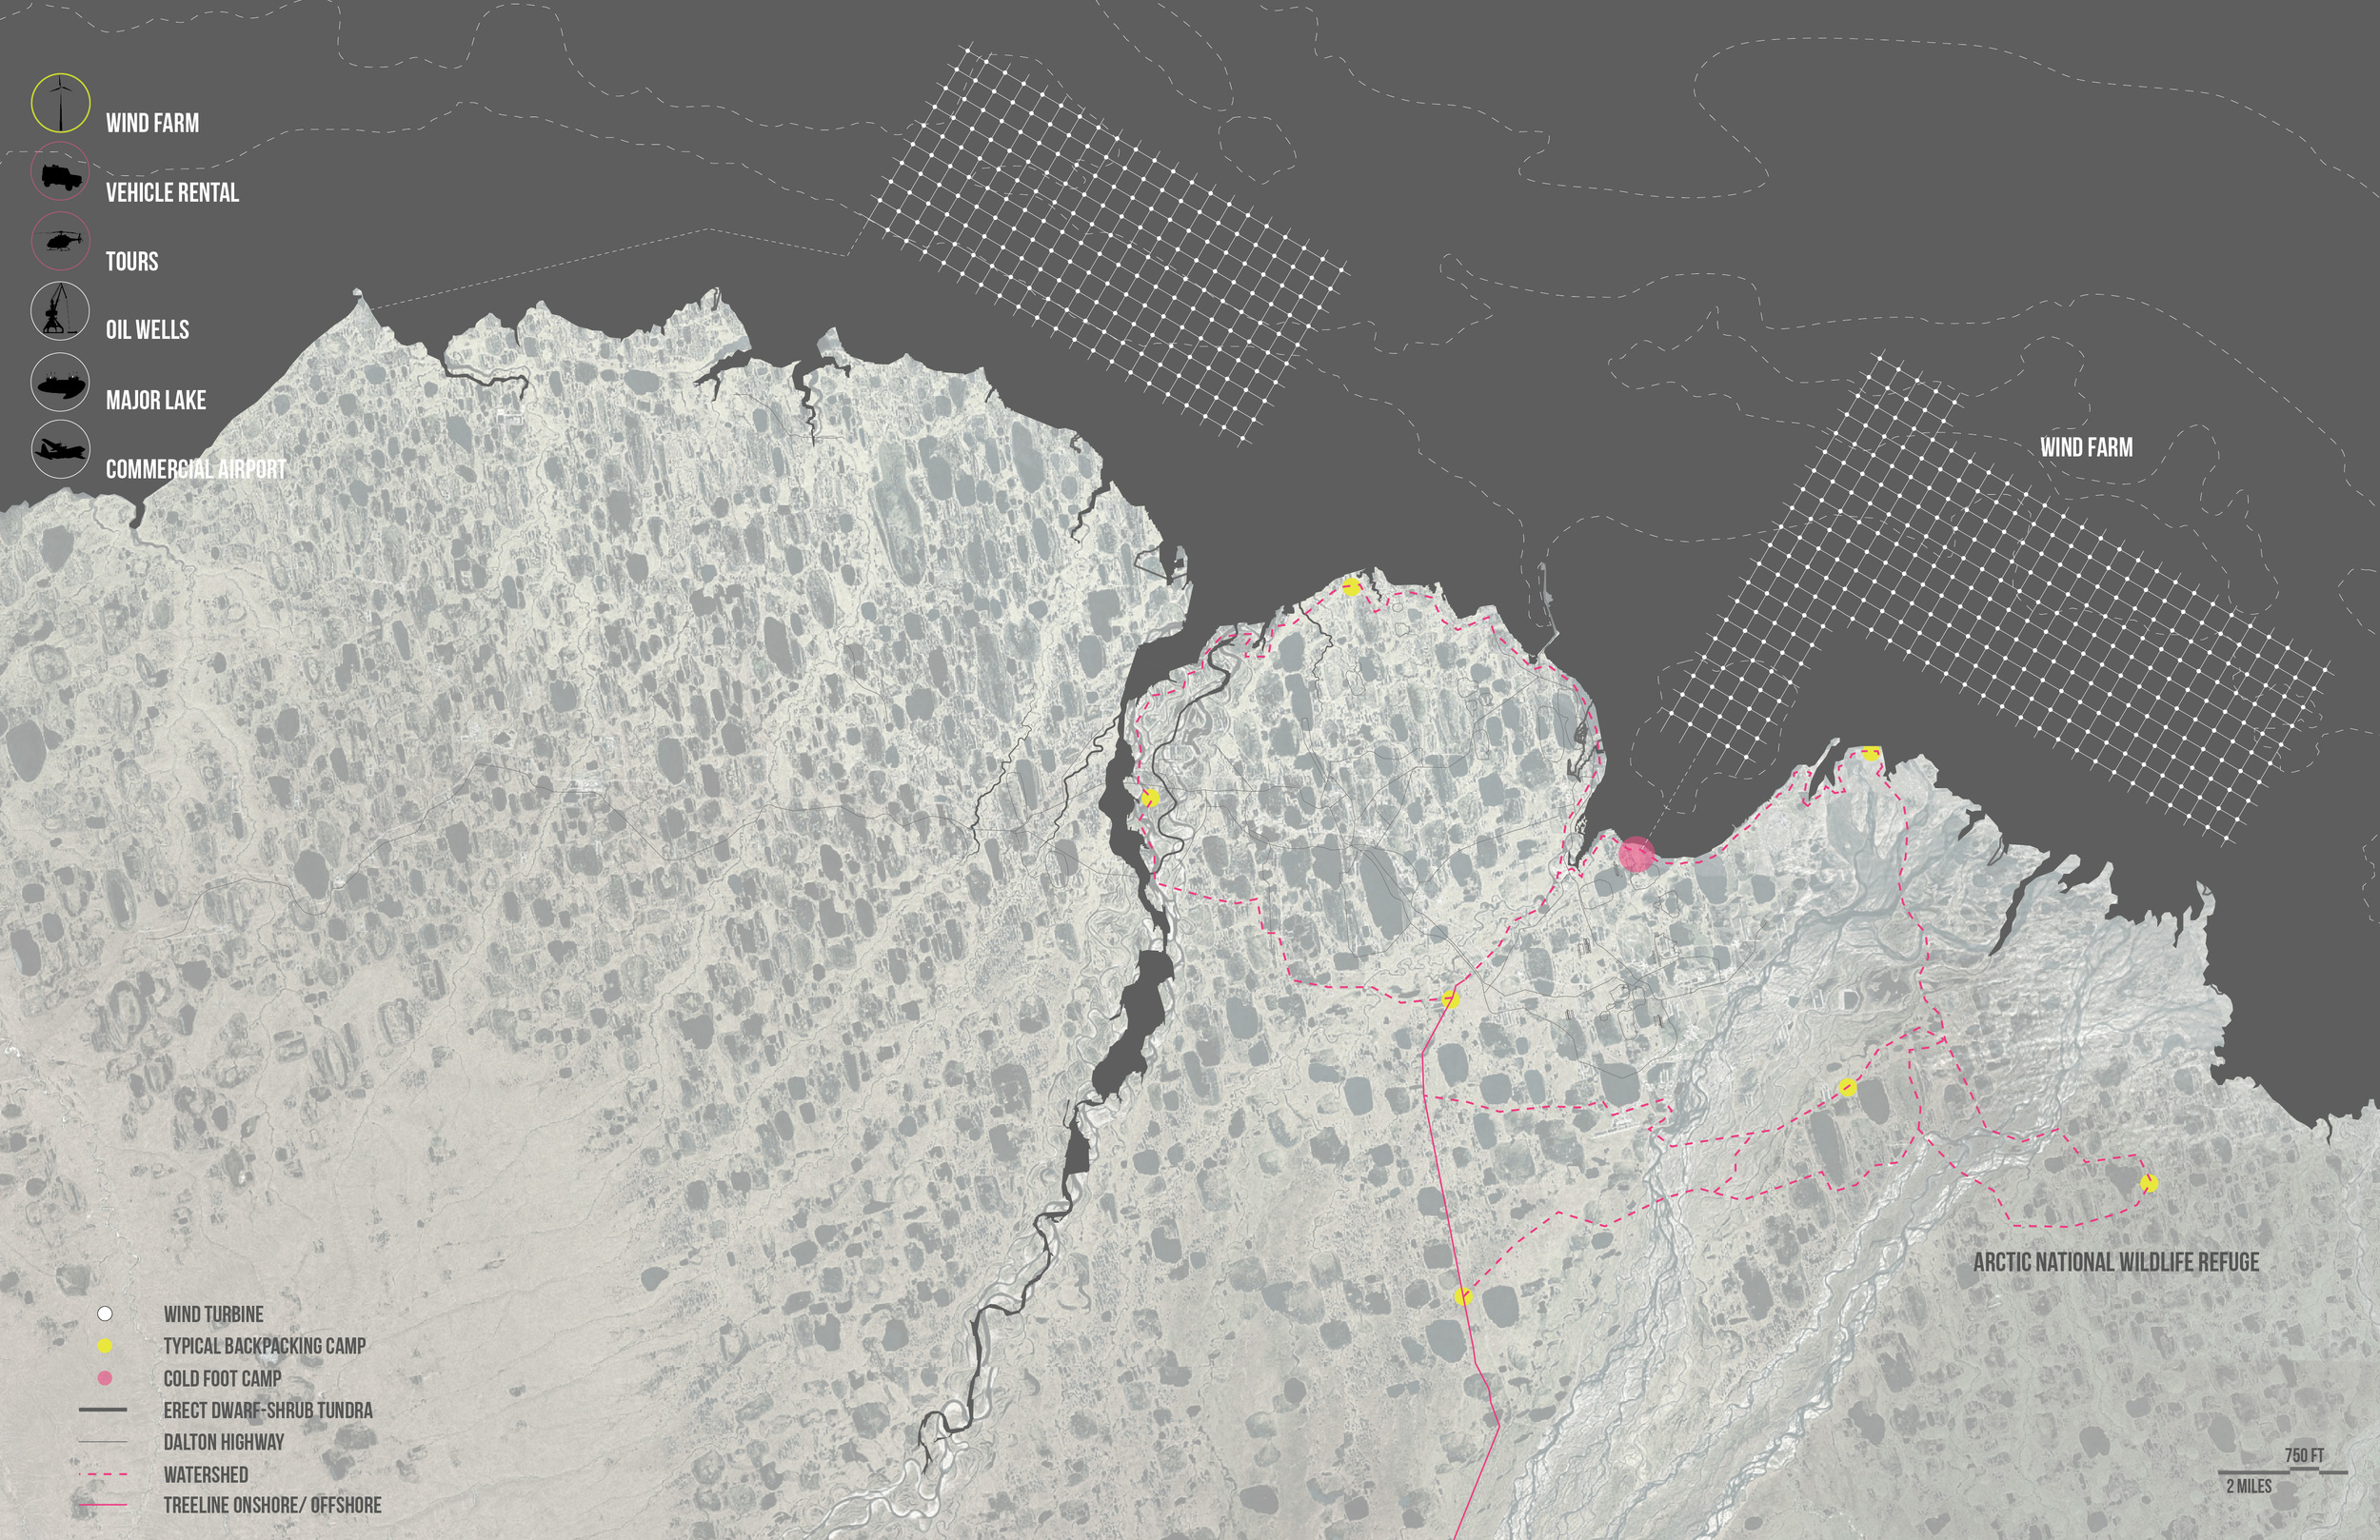
Prudhoe Bay 2012
Prudhoe Bay is the last stop along the Trans-Alaska infrastructure. At this location where the North Slope meets the Arctic Ocean.
Prudhoe Bay 2015
In 2015 the offshore hydrocarbon extraction will begin off the coast of the North Slope near the Hanna Shoal, a sensitive marine hotspot. Establishing access for tourism here will help protect the most sensitive ecological zones.
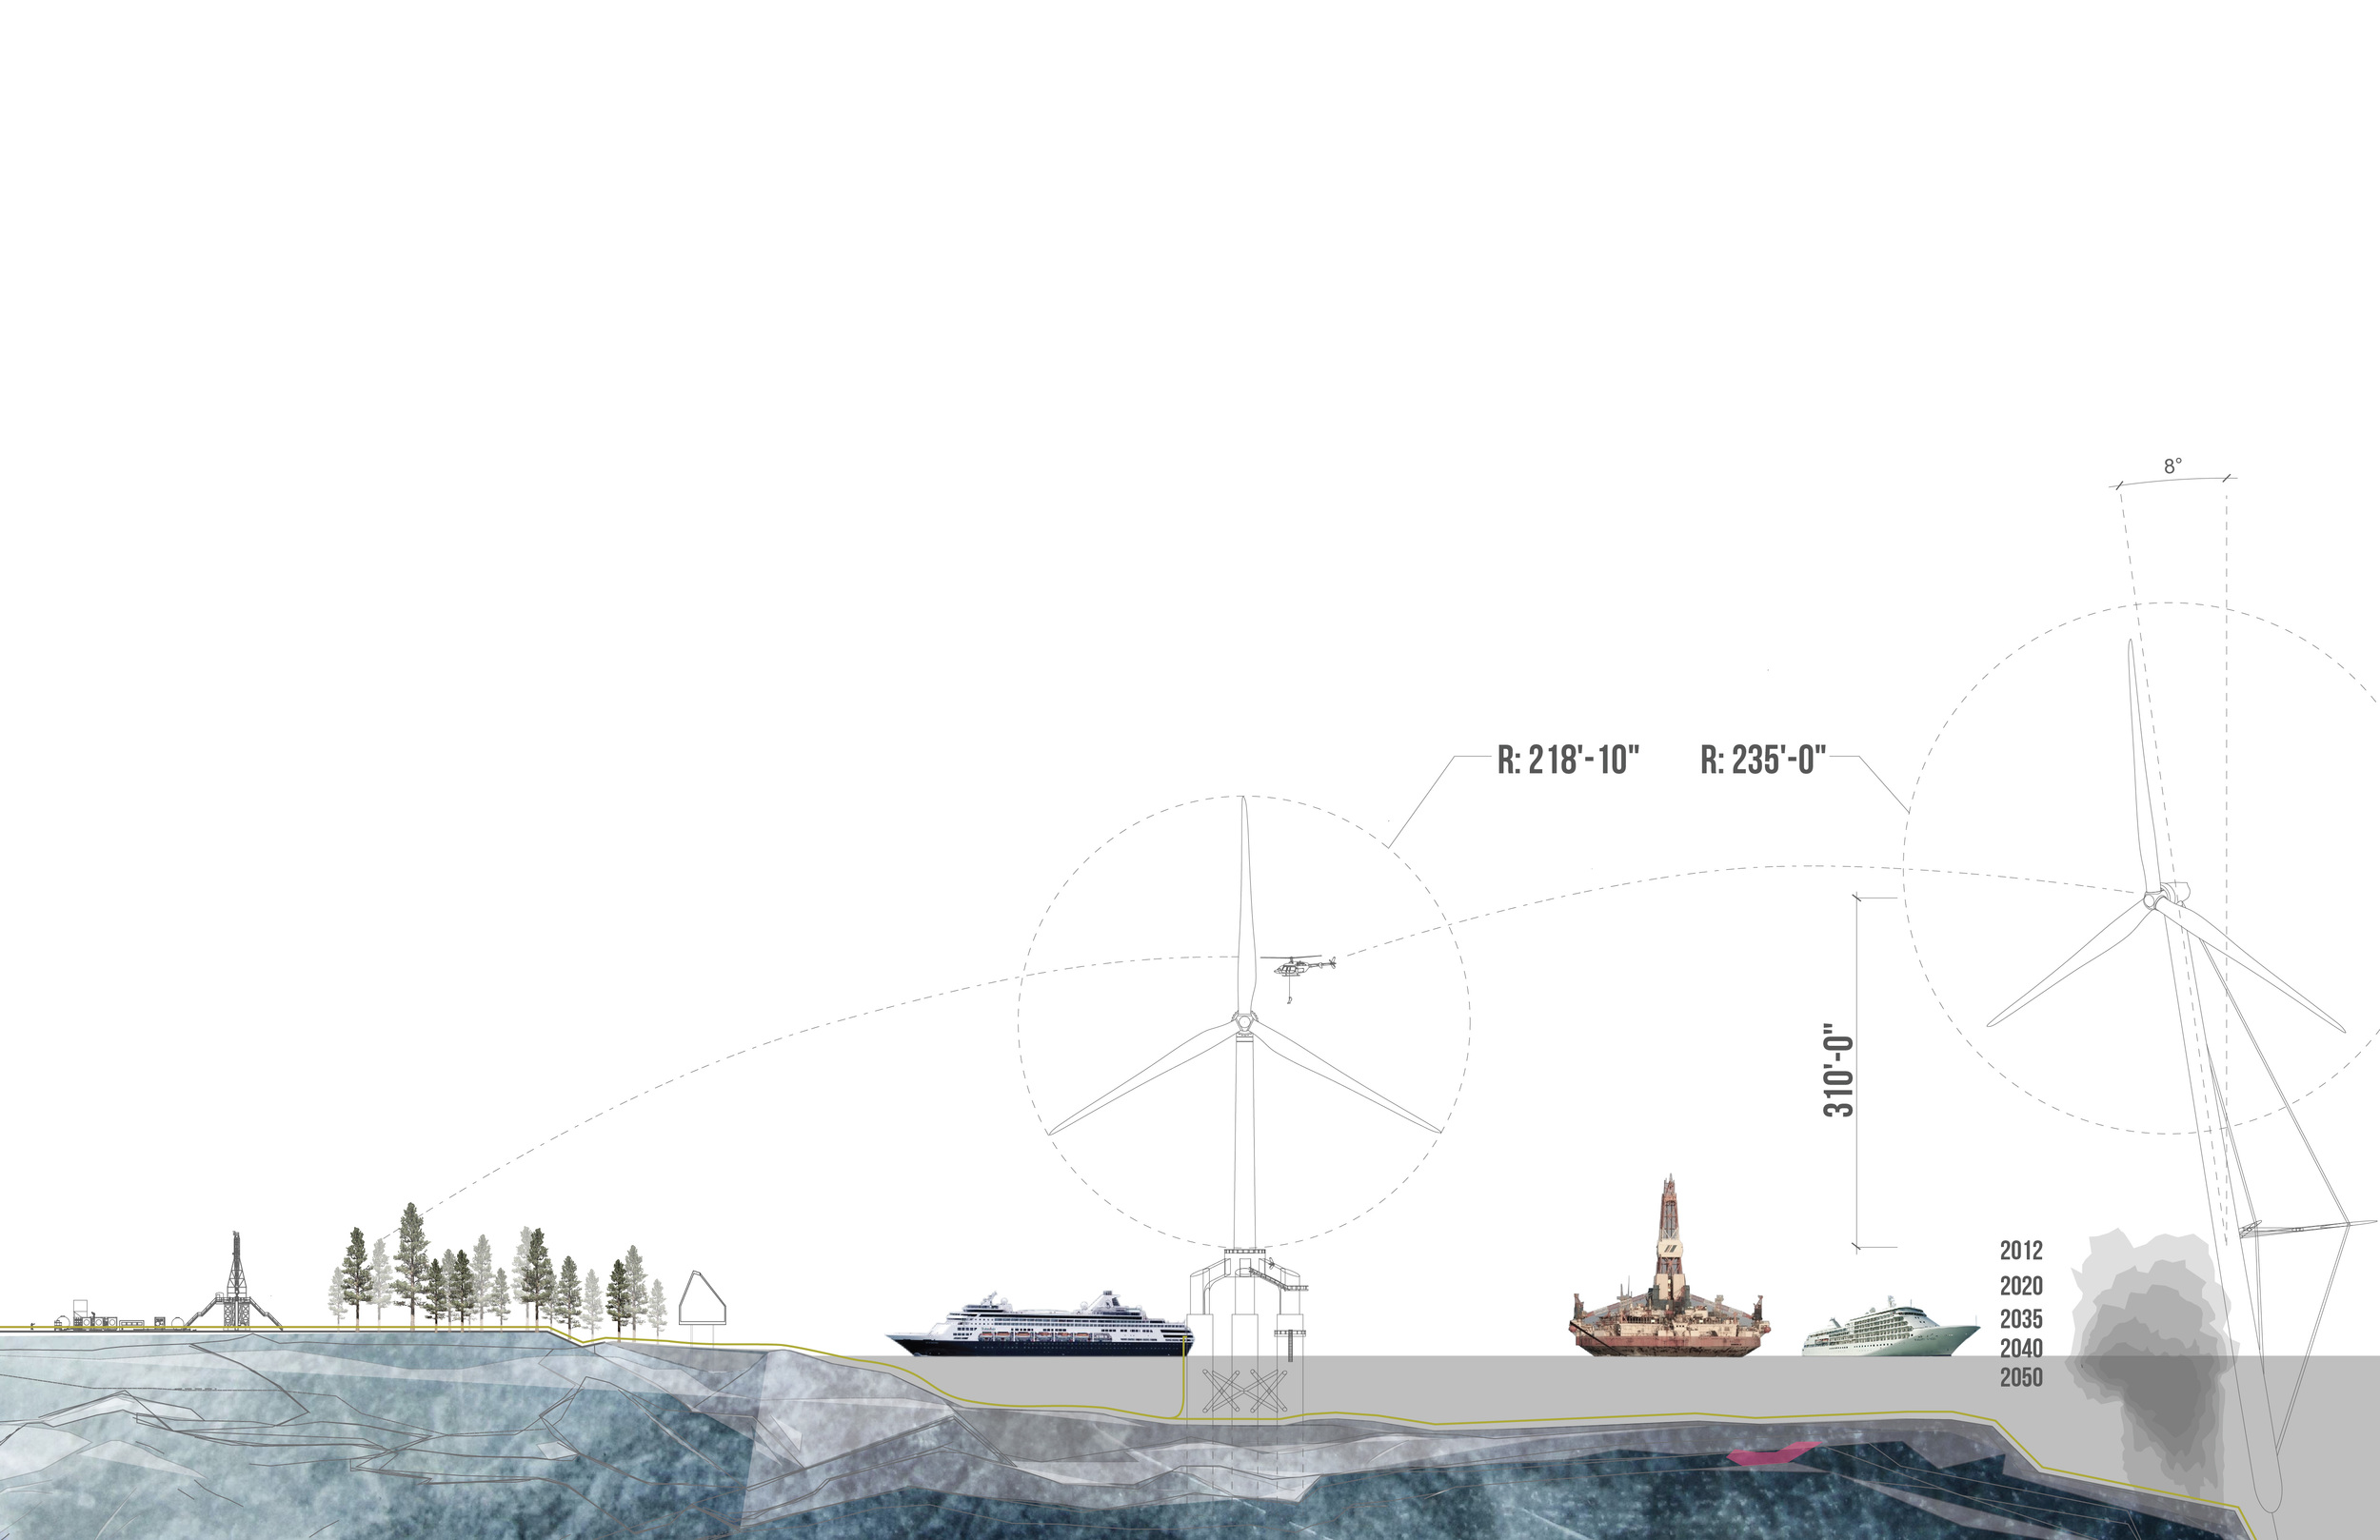
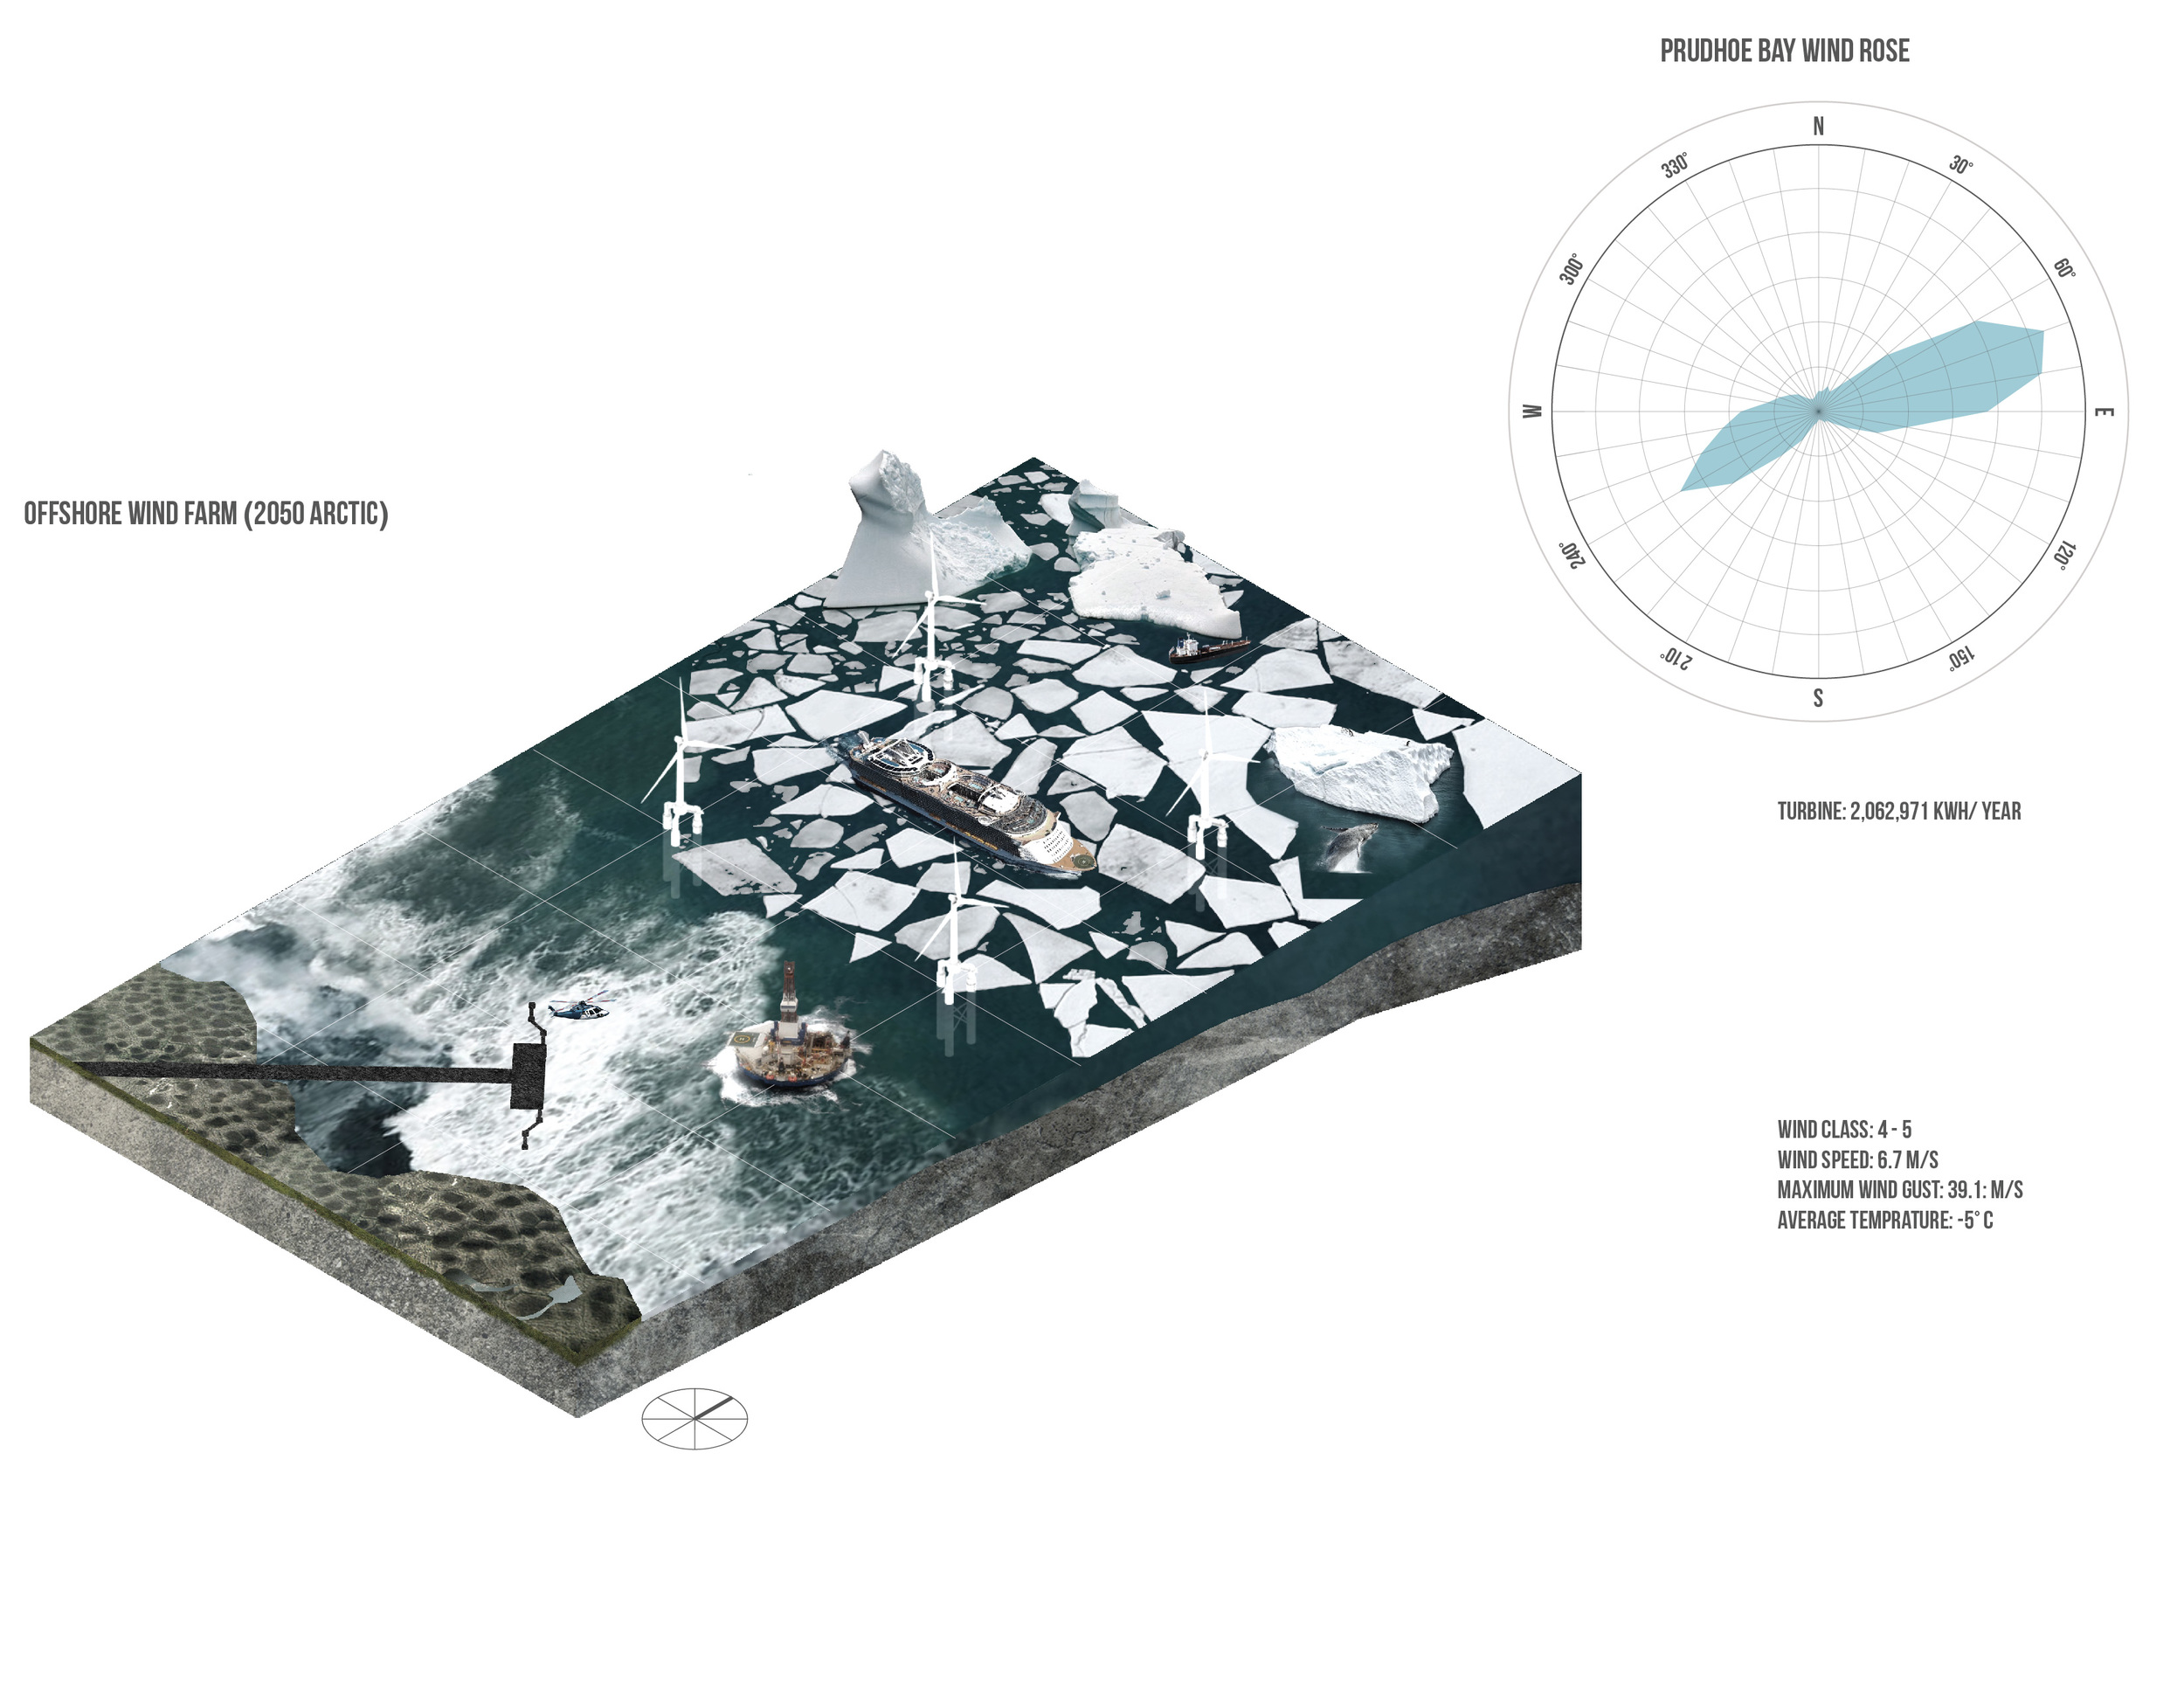
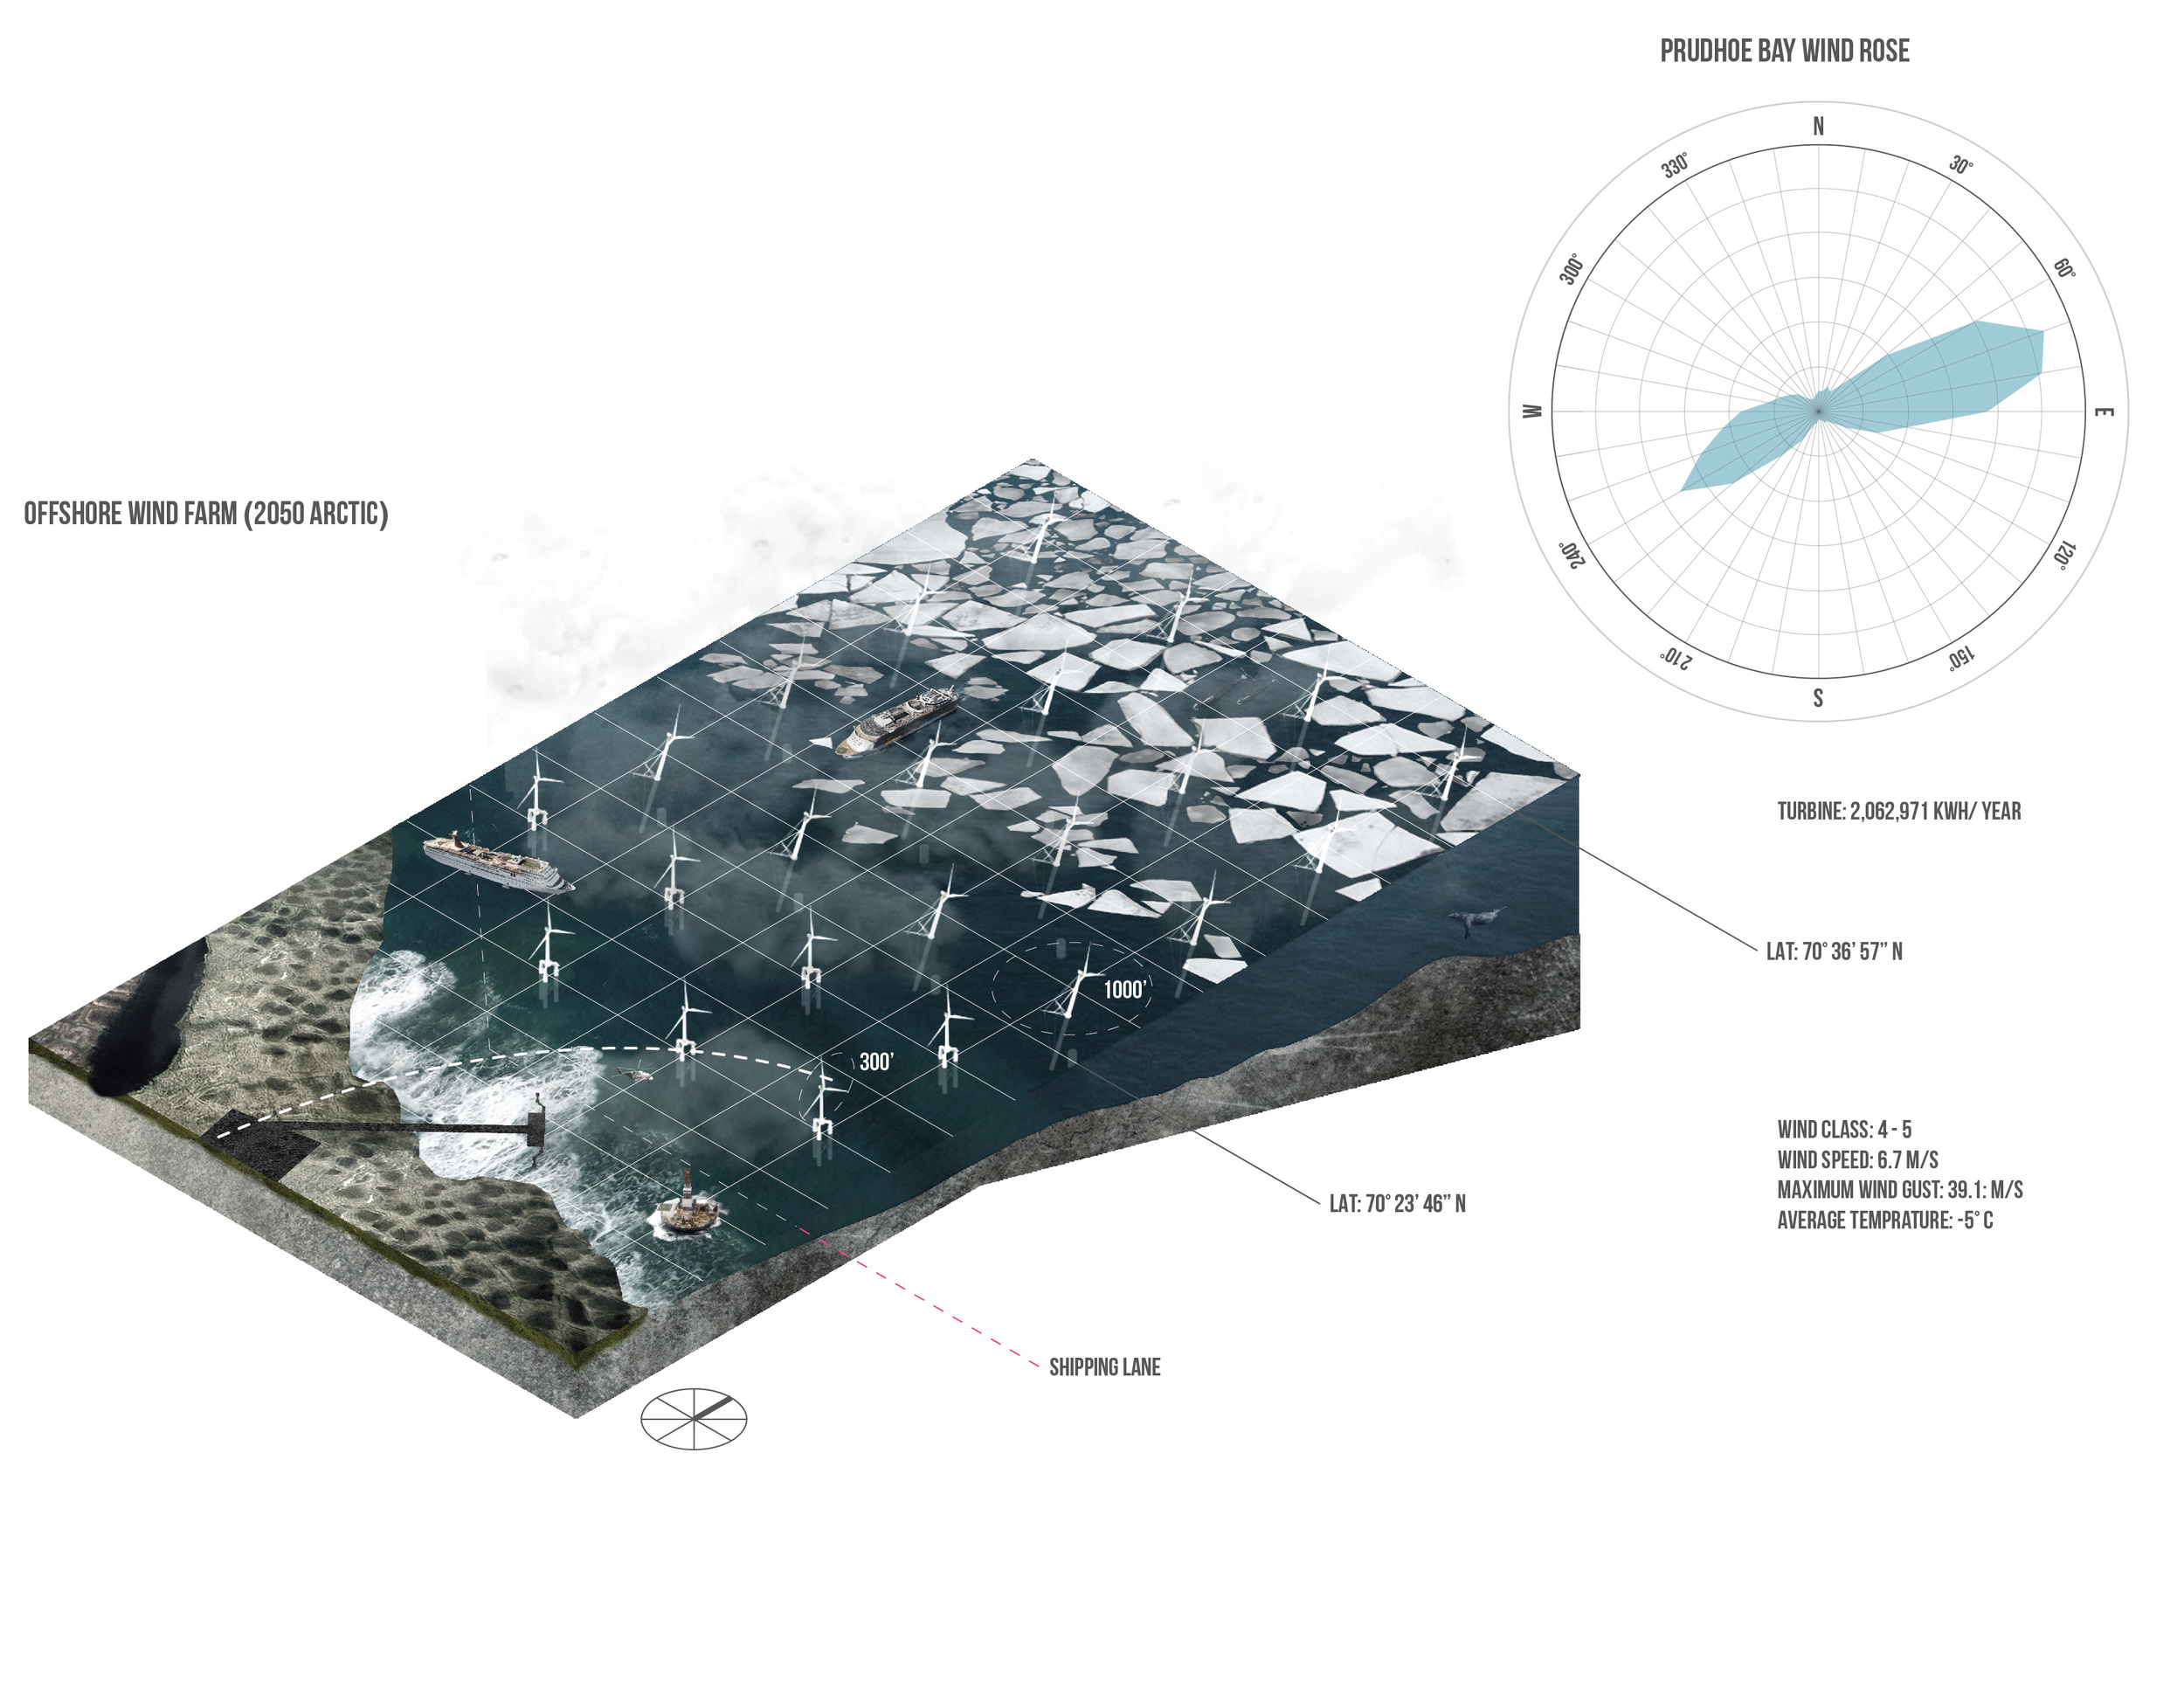
Prudhoe Bay 2050
After the hydrocarbon industry’s operations recede parallel with the continuous Arctic ice cap, Tourism operations can expand by taking advantage of the increased water navigability during tourist season and the increased availability of the hydrocarbon operations infrastructure. Wind farms will begin to occupy the territories in the high wind zones off the coast and connect to the U.S. electrical grid.
Prudhoe Bay 2050
Between the permafrost ponds near the shores of the Beaufort Sea camps can be installed to serve as basecamps for hunting and other recreational activities.
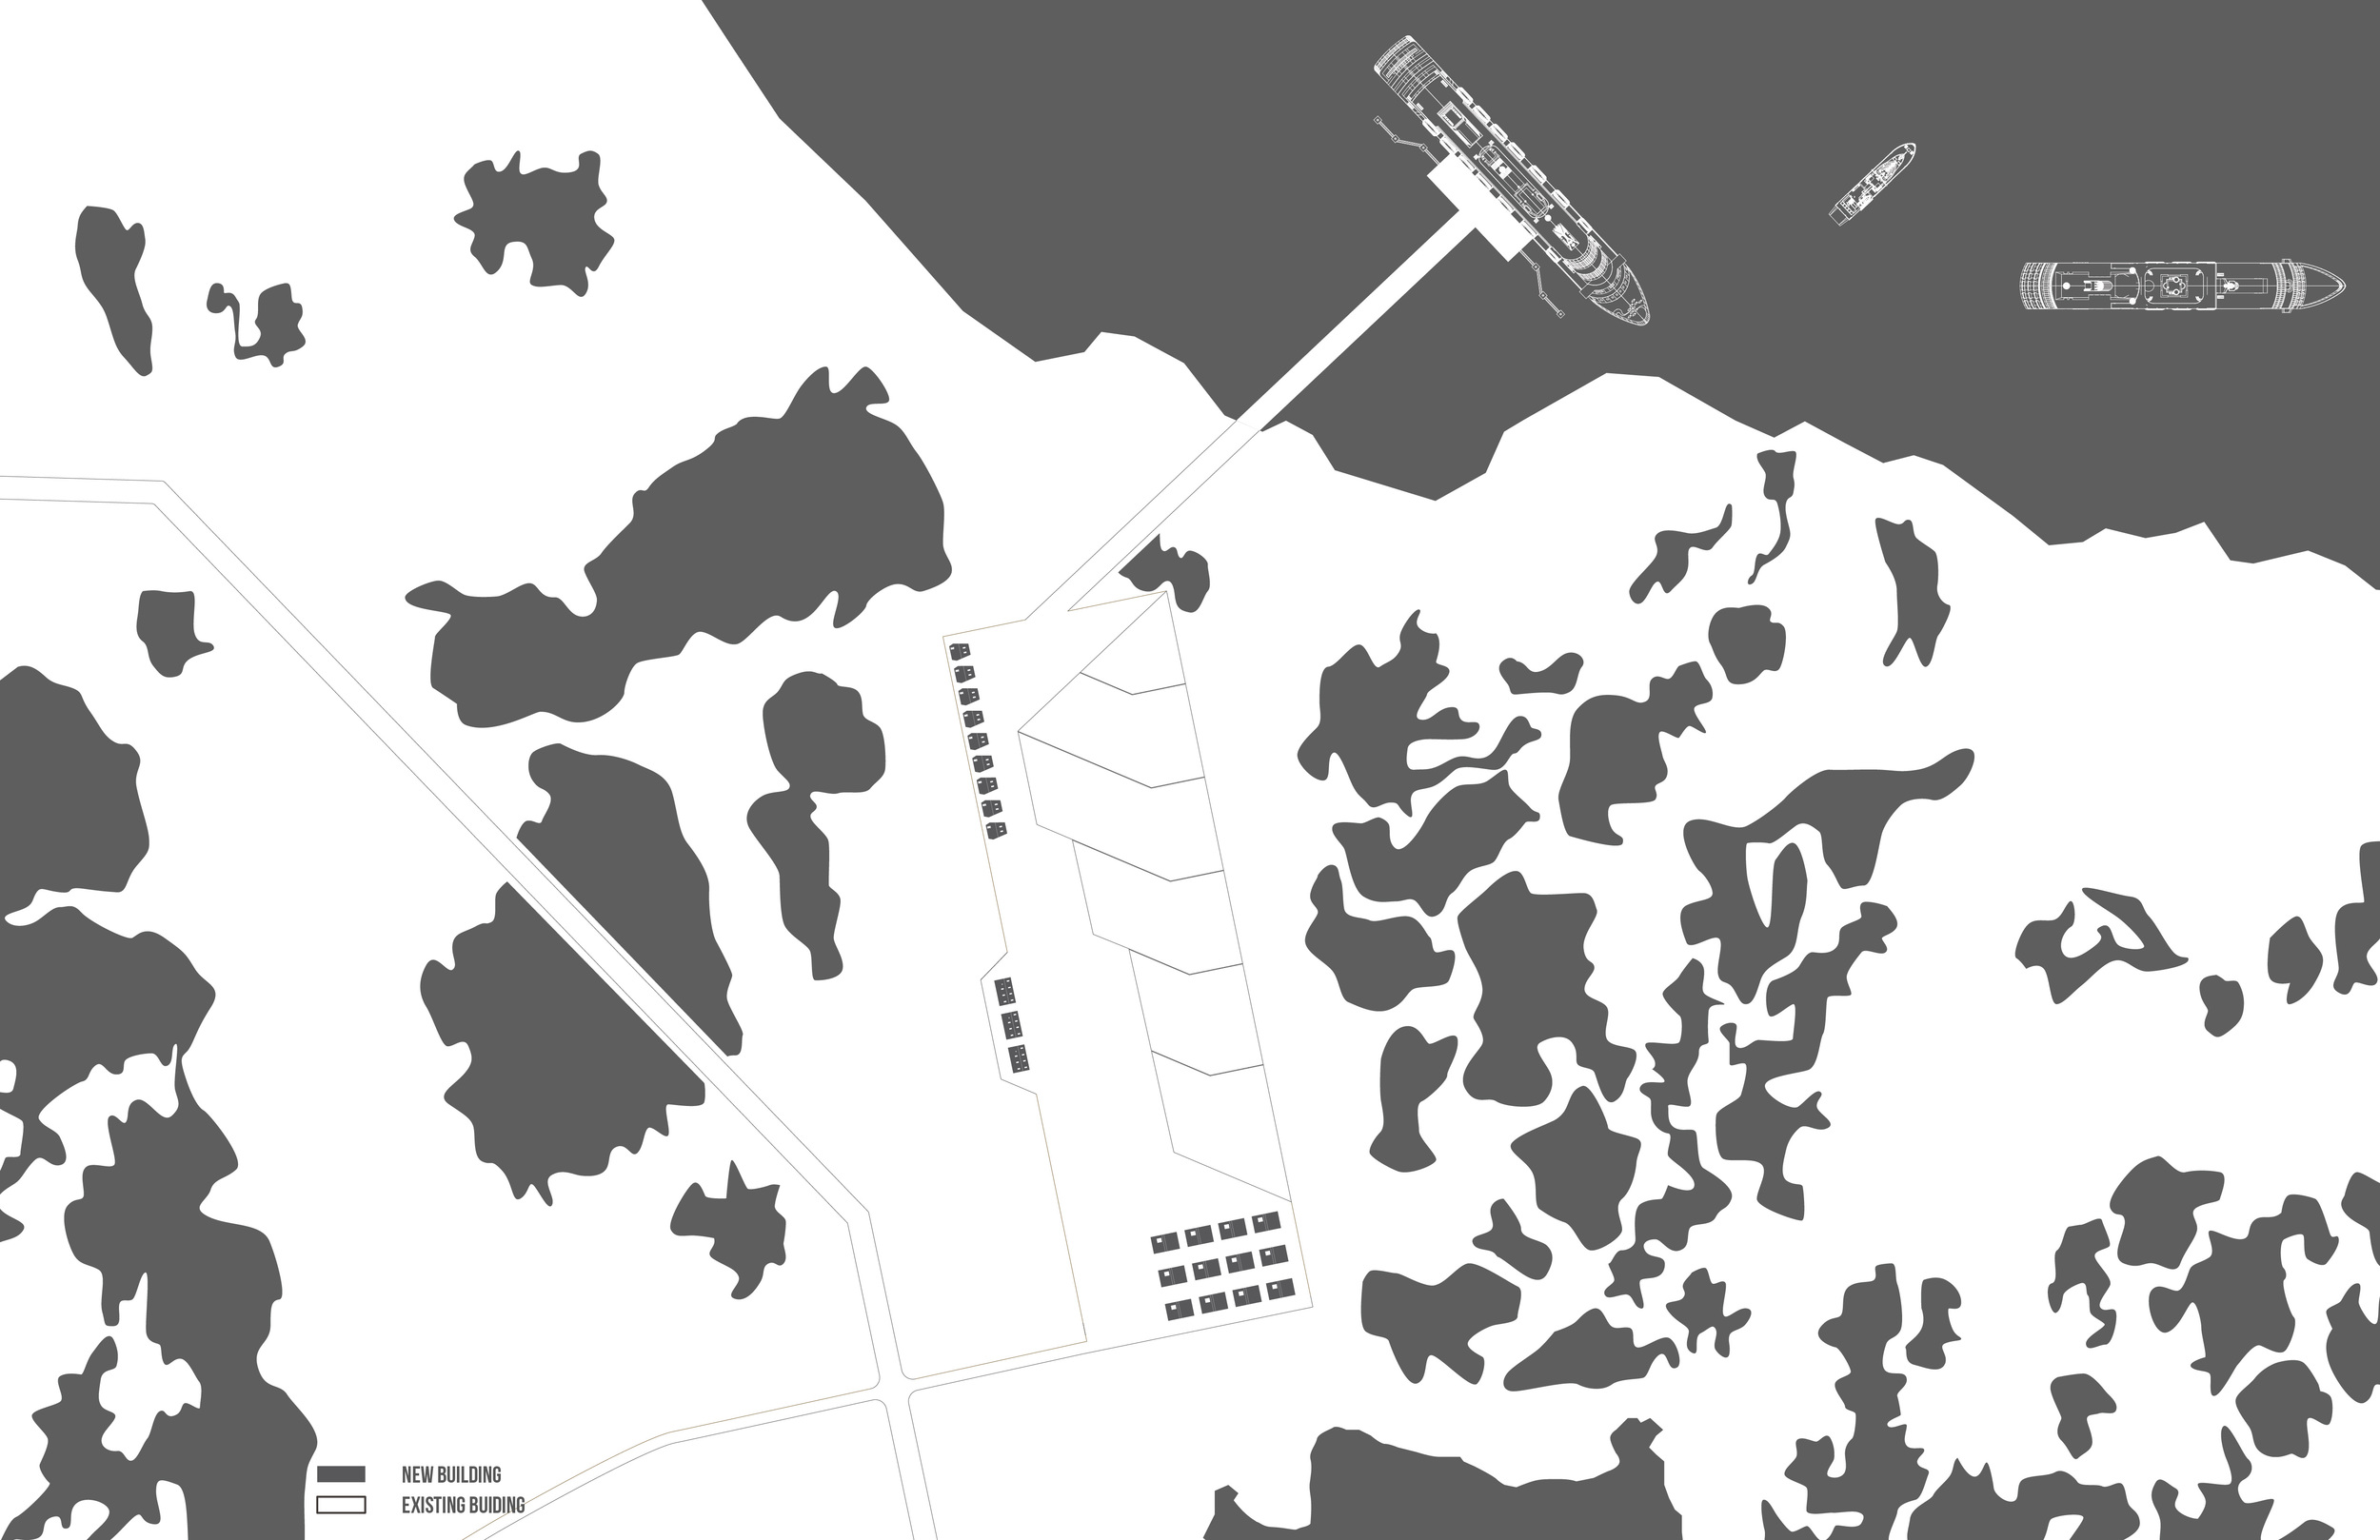
Prudhoe Bay Camp
Temporary worker housing installed for oil operation to house the seasonal workers can be repurposed for use by tourism operations.
Prudhoe Bay 2050 Energy Operations Local
Prudhoe Bay 2050 Energy Operations Regional
Prudhoe Bay 2050
New Trans-Alaskan Armature
This investigation reeinvisions the future of the pipeline’s infrastructure with the transformation the latent, single use infrastructure into an armature that couples service and extraction with recreation and access. This goal will be achieved by introducing renewable practices that will be built to supersede the archaic energy methods and enables the construction of new landscapes that services both the public and private industry.
Filling the Energy Void
Over the next 40 years the biomass, solar, onshore and offshore wind energy development can grow to a level that can sustain Alaska’s population growth and contribute the energy grid of the lower 48 states.
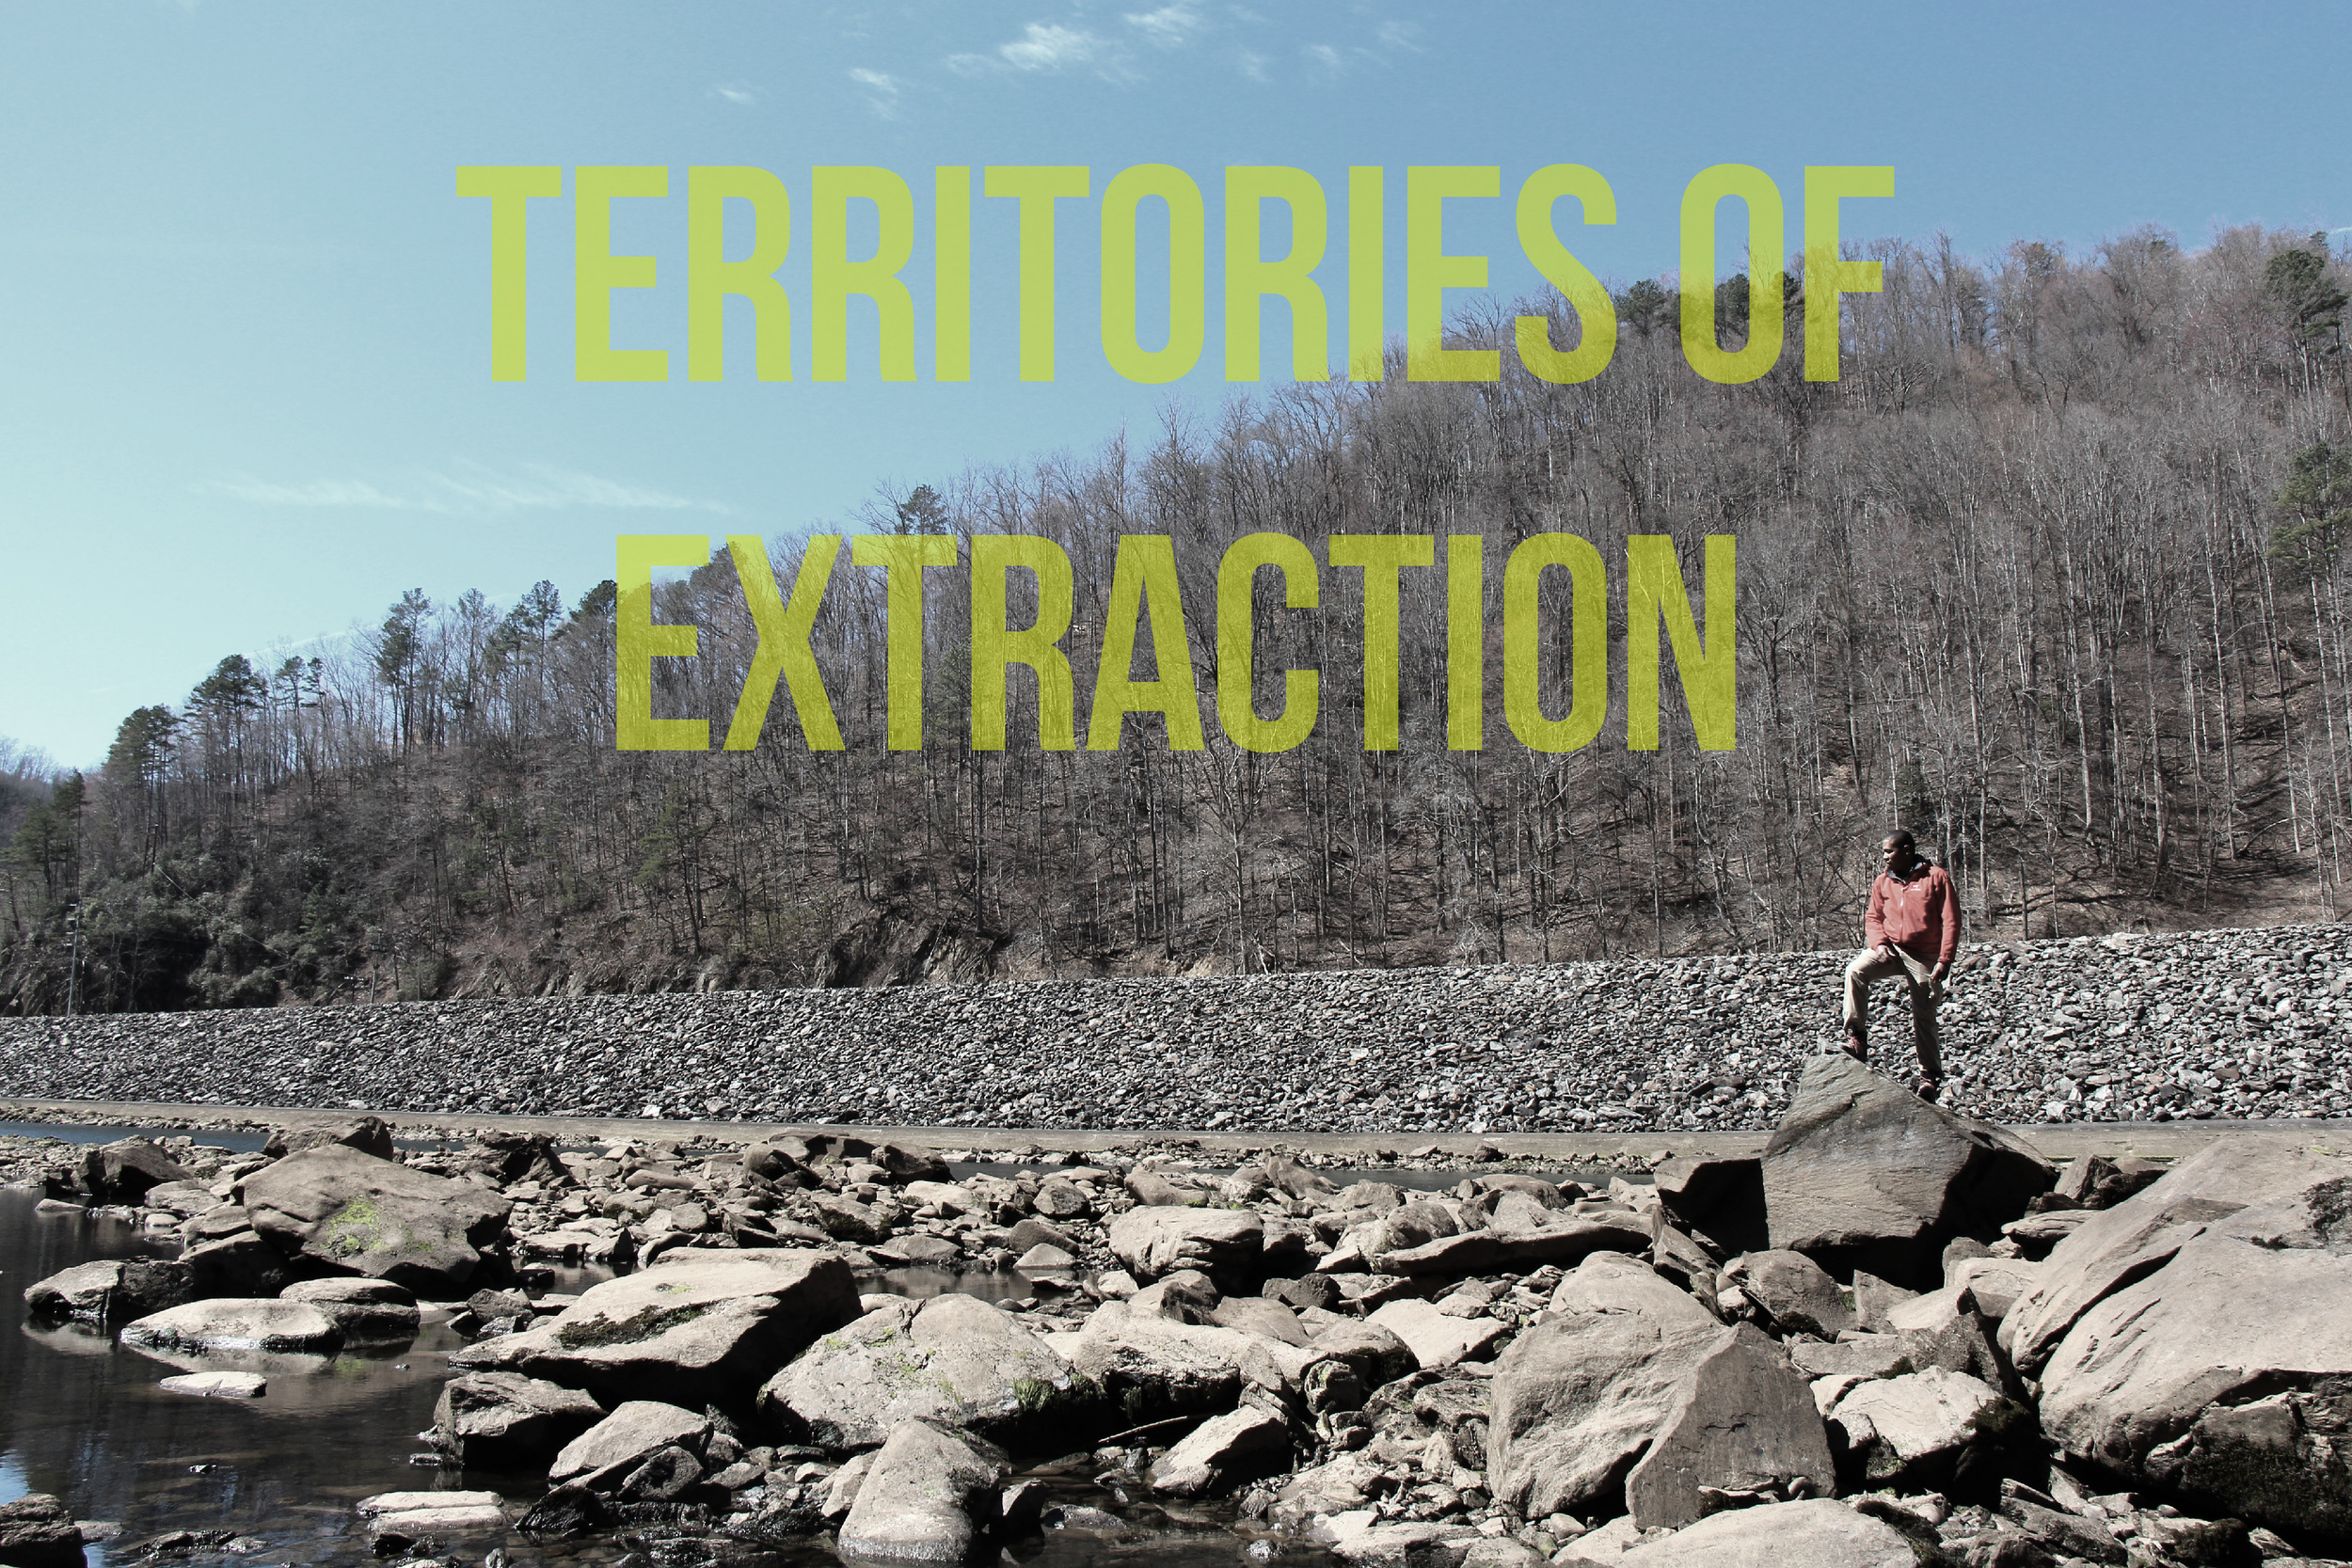
Territories of Extraction

Structuring latent sedimentation flows for future resiliency
The site begins at the mouth of the Miami River and extends south along the edge of Northcentral Biscayne Bay in Miami, Florida. This project operates at the crux of water pollutions from upstream contaminates into Miami River, stormwater outfalls along Brickells shore, storm surges from the Bay and future building developments pushing along the waterfront in Brickell. Acknowledging the future sea level rise and the storm surge models, the intervention aims to amplify the existing phenomena of sedimentation accumulation on the Bay projections to rise with the city's development and surging seas. A cue was taken from an existing natural process in the everglades. For a precedent I studied the sedimentation islands, which historically filtered the aqueous ebbs and flows and buffered the inland of South Florida. For an intervention artificial sedimentation heads were designed and positioned in existing points of natural sedimentation accumulation to speed up the adolescent formations to establish new ground. The site will serve as a future wetland, providing habitat for the flora, fauna and other wildlife, which is becoming extremely scarce.
Miami, Florida has grown from a history of spectacle and aqueous development. Heavy pollutants water pollution and rising tides are threatening the growth of the South Florida’s main attraction from the Miami River are disturbing economic development in the Brickell area.
Structuring Latent Sedimentation Flows for Future Resiliency
This project aims to generate a wetland habitat from land processes and formations naturally generated on site before the urban development. By reclaiming the natural process landforms are generated with technological catalysis to enable economic development and protect the onshore land from future natural occurrences.
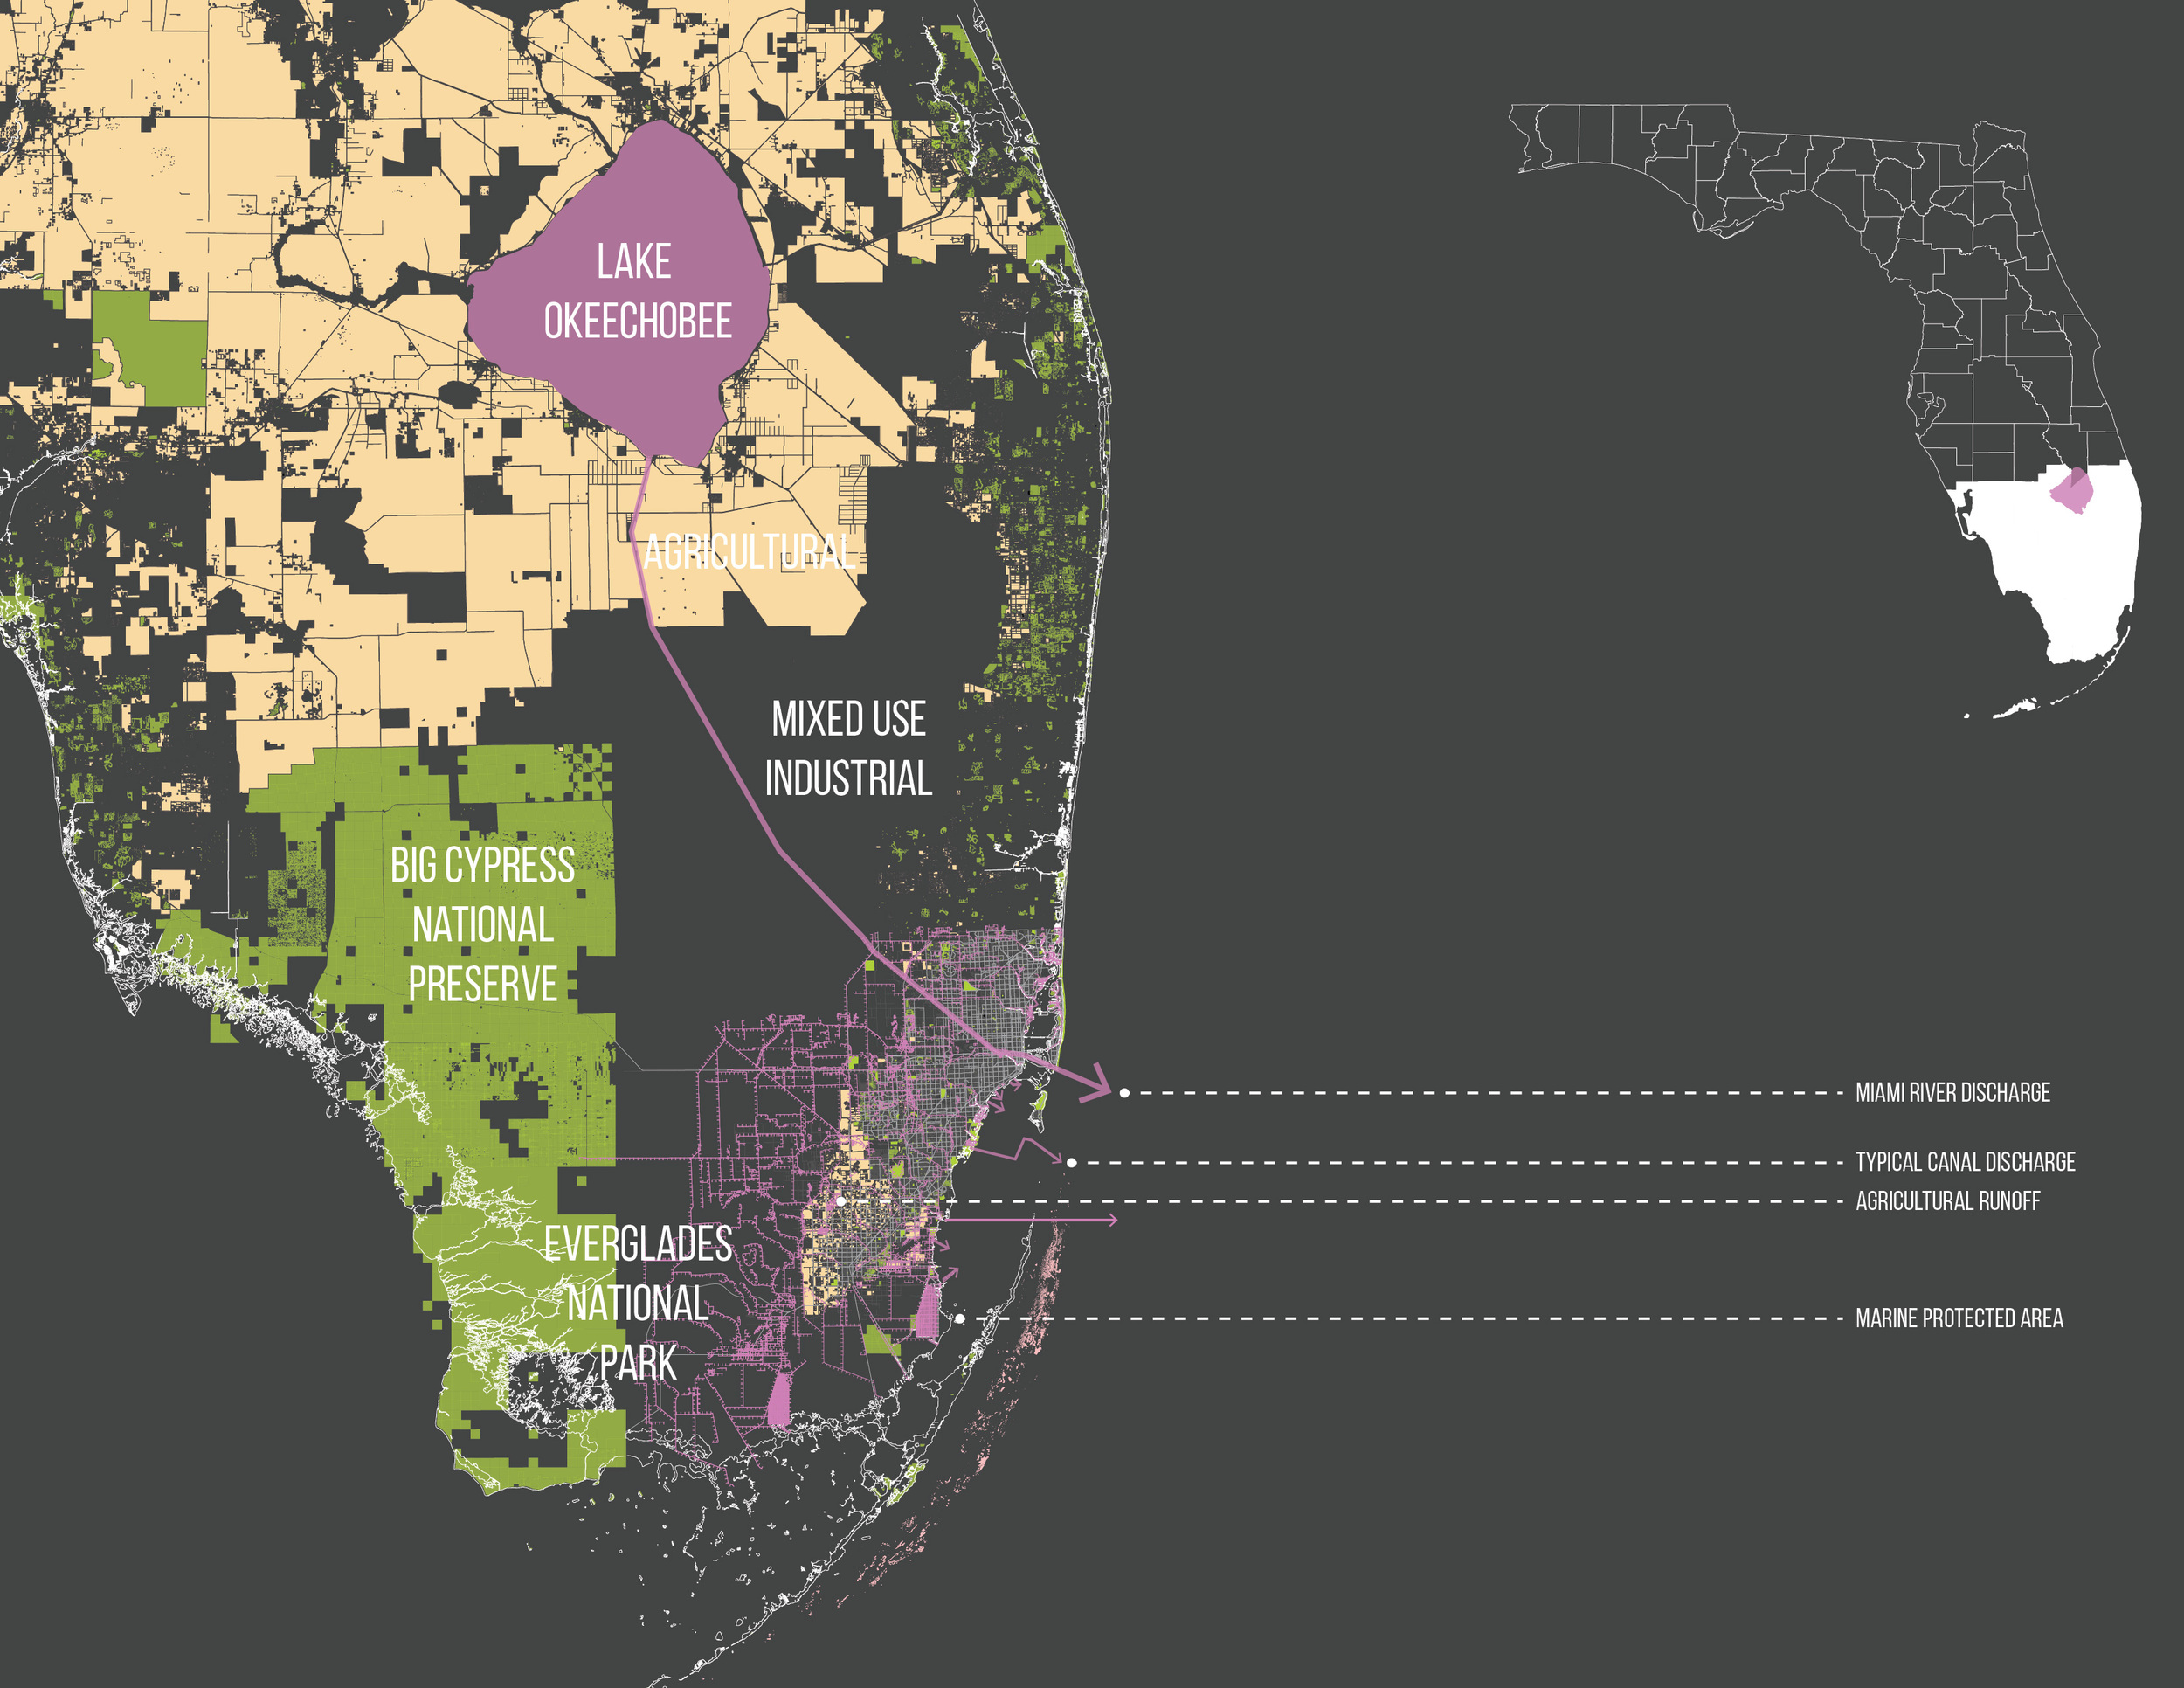
South Florida Fouling
The polluted waters in the Miami area begin much further inland. Agricultural and industrial runoff into Lake Okeechobe and the Miami Rivers carry fouled water and polluted sedimentation through the mouth of the river and deposits them into Biscayne Bay.

Biscayne Bay Water Pollution
Storm sewer outfalls compound the water quality problems in Brickell, Miami. These factors deter waterfront development and deplete aquatic life here, which in turn stifles economic development.

Miami Effluent
In the city’s 2040 development plan Miami is planning future development for Brickell, however, this area has some of the most severely polluted effluent in the region and is vulnerable to severe storms. How can we deploy an intervention to mediate the environmental impact while providing future resiliency against the elements?

Sedimentation Islands
Historically this landscape of South Florida naturally protected the bay and shores from pollution. The low sloping lands of the everglades slowly sifted the waters as they passed through the marshes towards the bays and oceans beyond. Within the marshes sedimentation slowly accumulated into nodes. Around these sedimentation nodes more sedimentation and water passes around in fractal formations creating a tail and causing more sediments to bind into the formation creating sedimentation islands. Together these islands created a network that filtered the waters before they reached the ecologically sensitive estuaries in southern Florida.

Interrupted Flows
Today urbanization cuts off the sedimentation islands, blocking the pollutants filtration process and the waters natural migration into the bays. In this particular incidence that you can see the sedimentation island cut off by urban development on one side and a nuclear facility on the other at the edge of Biscayne Bay.

Everglades Filtration
At the regional scale the contention between the natural filtration infrastructure and the encroaching urbanism is most apparent. In a small zone at the southern tip of contiguous Floridian coast, the terminus of the sedimentation island network is still intact.

Joe Bay
Joe Bay is both an example of the end of the sedimentation filtration network and a microcosm of the entire sedimentation system. Here the water and silt sifts South through the matrix of landscape x and into an estuary before the effluent is flushed out into the larger bay between tidal cycles.
Here I began to investigate methods for a contemporary solution for a problem that was historically mitigated naturally on site.

Patterns of Process
This segment of the sedimentation islands and Joe Bay became the blueprint for site interventions. I began by deconstructing the anatomy of the landscape to understand the network and nodes that form the filtration matrix. The goal is to use my understanding of this natural script to engineer a synthetic landscape with improved functionality.

Site: Brickell, Miami
At the edge of the site several storm sewer outfalls directly inject runoff water into the bay during rain and storm events.

Bathtmetric Heightfield
To illustrate the bathymetry of the bay I interpolated a point cloud NOAA data. I transformed this structured geodata into a bathymetric surface and generated heightfield to more clearly interpret the bay floor. Here, I discovered a ridge that trapped the polluted water discharged from Miami River between tidal cycles. This confirmed the high sedimentation and pollution volumes that was discovered in local academic reports.

Miami River Discharge/ Biscayne Bay Hydrology
The current of the bay flows from South to North, however, the flow from the Miami River augments the bay’s flow and pushes the waters around Brickell in the opposite direction. This traps the polluted waters between the bulkhead, causeway and the bathymetric ridge creating an eddy along the Brickell district.

Site Fluctuations
Rising tides are putting additional pressures on the low bulkheads. During extreme weather events winds push storm surges inland, flooding Brickell and causing major damage to homes and businesses. When looking for an intervention it was imperative to develop a solution to midigate the pollution problems while also protecting the inland from surging waters.

Sedimentation Formations
After building the bythemetry of the bay I began to further analyze other the bythmetric properties here. By building an algorithm to measure the surface friction and sedimentation accumulation I discovered naturally occurring sedimentation formations in the bay. These formations are similar to the sedimentation inlands that existed on site before urbanization and still can be found across undeveloped lands of the everglades. This latent sedimentation accumulation provided agency into the sites intervention.
The major forces acting on the site prevent the Brickell District from reaching its full development potential. To mitigate the forces acting on the site we needed to address the surging waters, high pollution and sedimentation discharges. How do we design for the future of this ephemeral landscape?

Design Proposals
Four scenarios were developed for consideration. The Urban Piers scenario worked to capture sediments in removable trays and filter pollutants before the water flowed into the protected marine area south of the site.
The “Baffle Filter Structures” worked with the tidal fluctuations by osculating with the currents. Trays within the structure would collect particulates as they passed through this section of the bay and out of the outfalls along the shore.
The next intervention considered is called “Aqueous Urbanism”. This is a series of components with four functions that operate as a network to combat the conflicts in the bay.
The proposal that was selected to move forward is a series of sedimentation is lands that organize the sedimentation deposits to perform as the natural edge that has been destroyed by urbanism.
Sedimentation Accumulations
Upstream from the Biscayne Bay agricultural and industrial lands along Miami River send metallic particulates into the water through runoff. Because of this, the sedimentation that flows out of the mouth of river into the bay has a high volume of magnetic material.
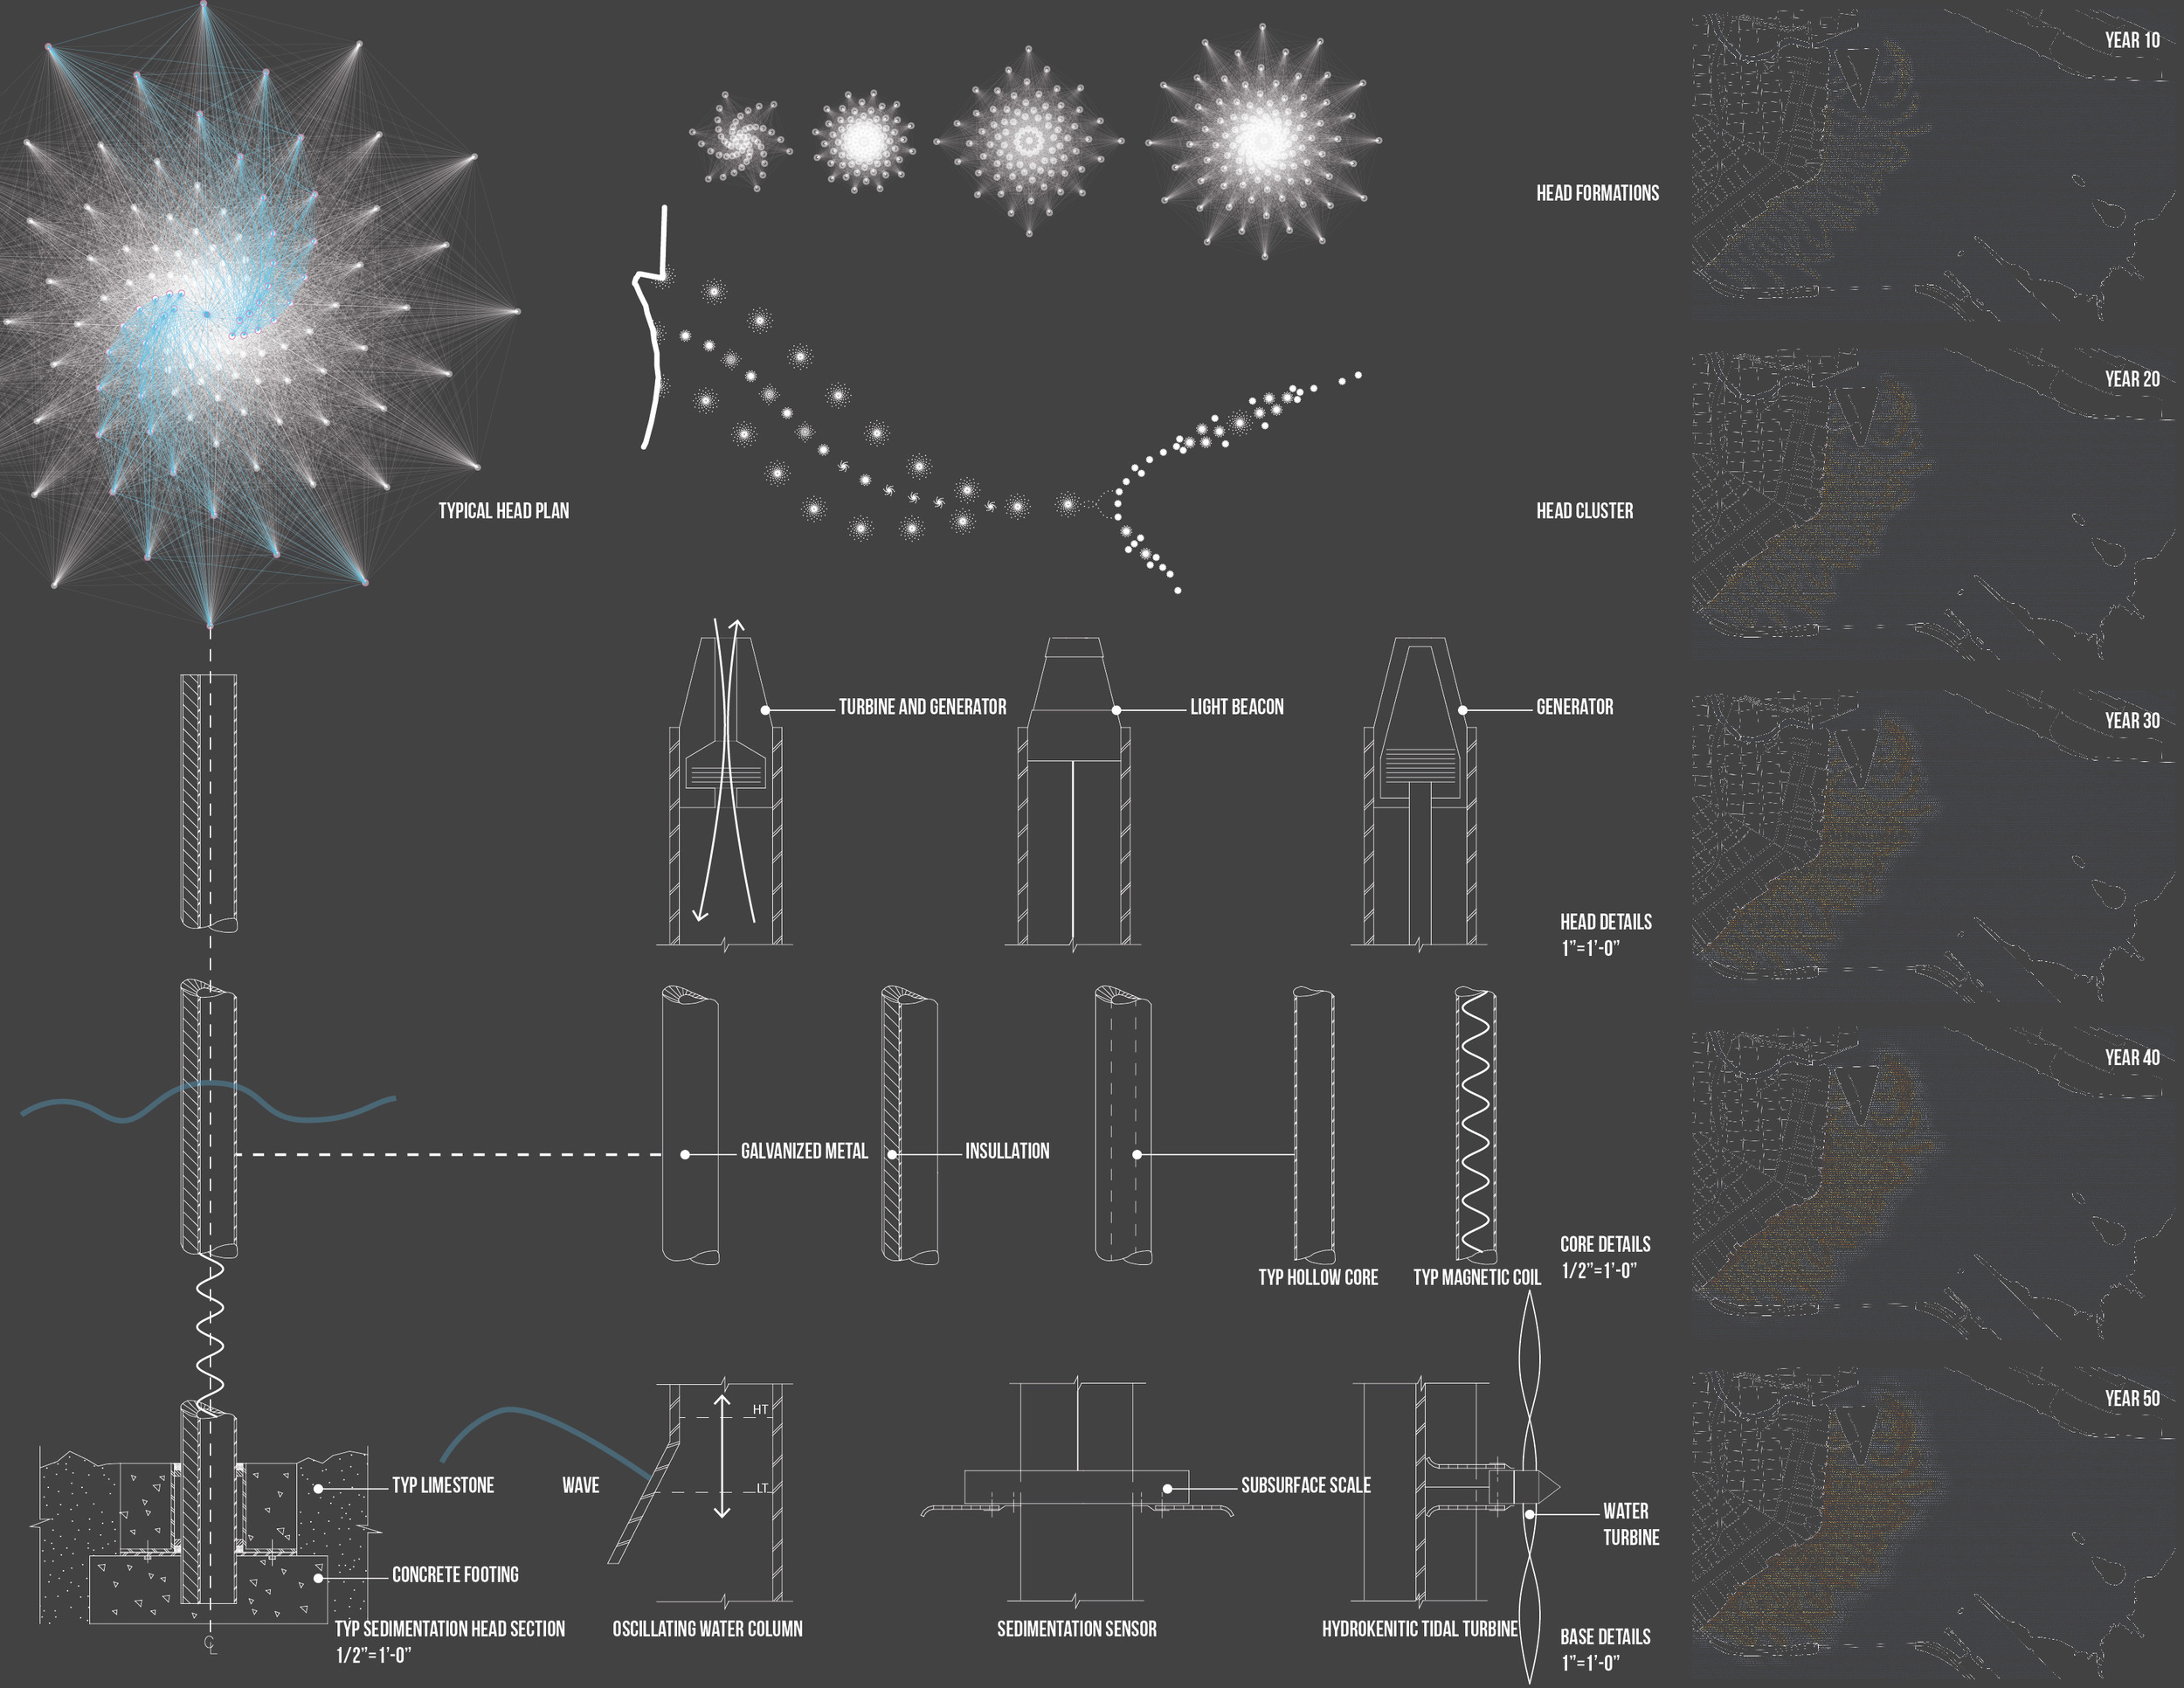
To amplify and curate the naturally forming sedimentation landforms, magnetic poles are strategically places in the bay in areas that have natural have high volumes of sedimentation accumulation. The poles act as artificial sedimentation heads which attract the sedimentation particulates. As the sedimentation attracts to the sedimentation head water moves across the site sweeping the sedimentation around the poles in fractal formations to develop sedimentation islands.
The sedimentation island will emerge from the below the surface of the shallow waters within 10 years. Over the next 40 years the island will continue to rise with the sea level and grow more tenacious.

Surge Buffer
Collectively the archipelago of sedimentation islands act as a buffer to protect the shore from surging tides.
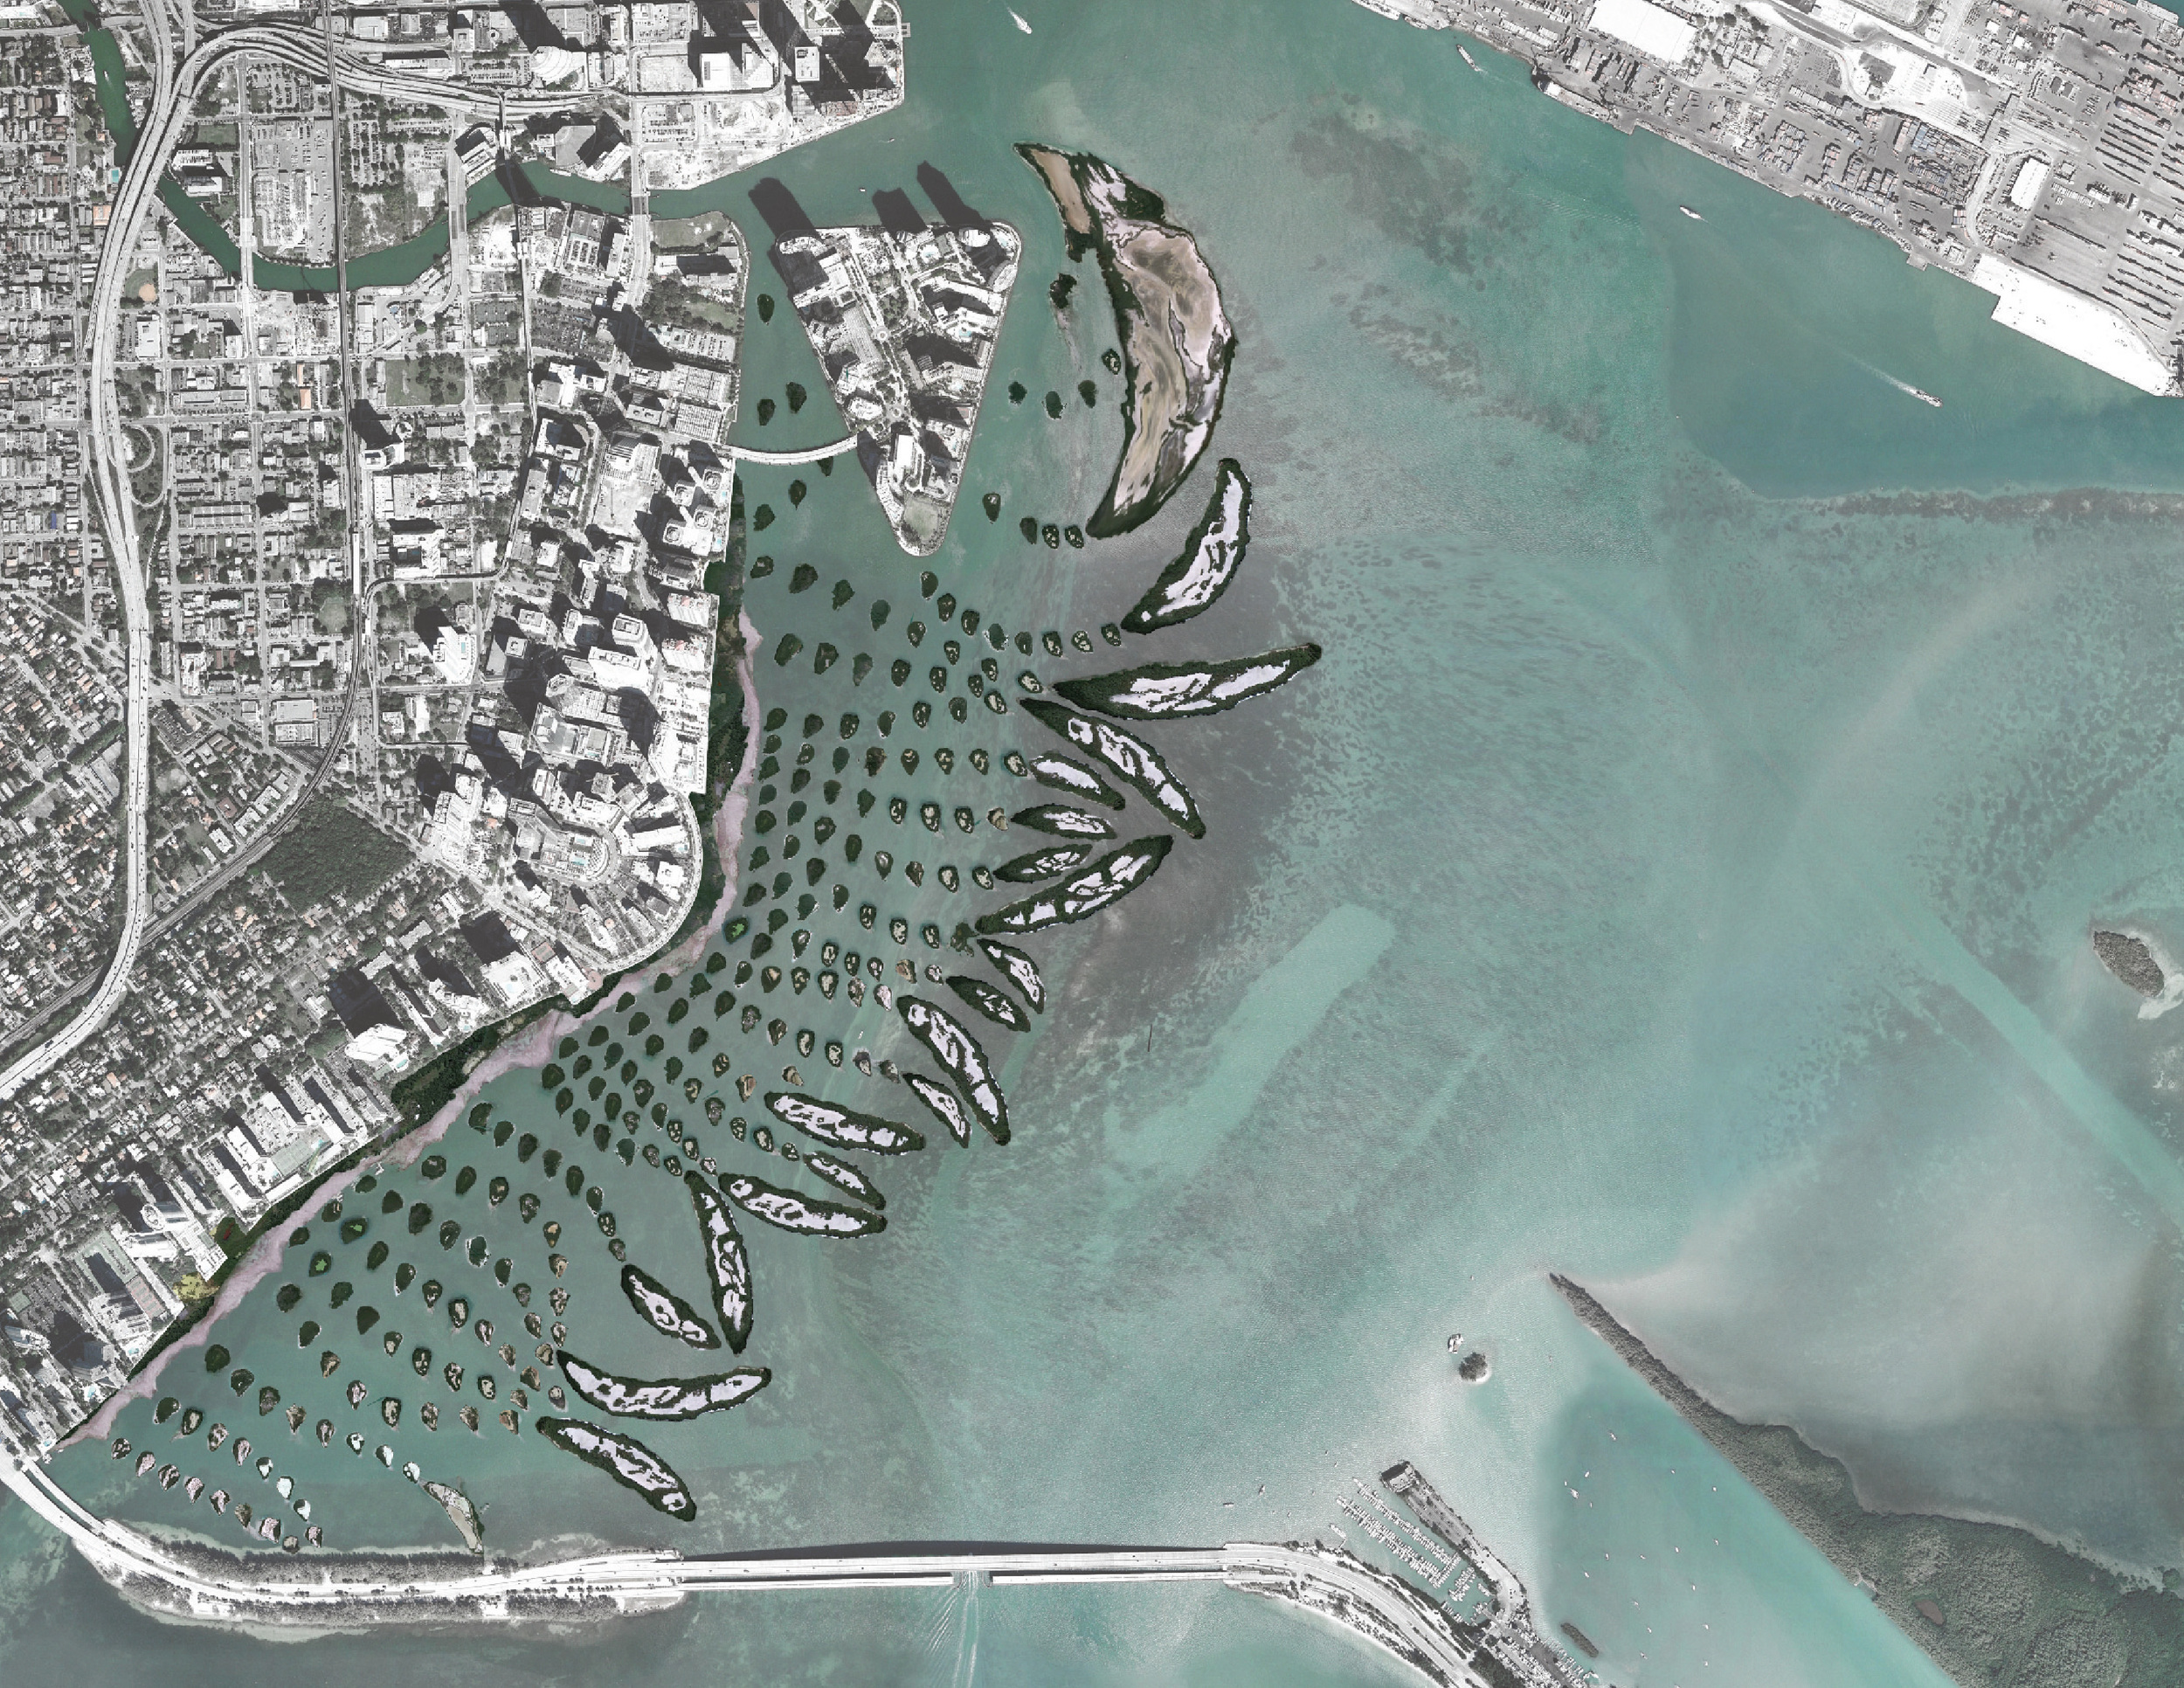
Aqueous Infrastructure
Over time this manufactured landscape will develop into an estuary – replacing the pond and slough which naturally protected the shore from natural disasters.

Reestablishing the Natural Gradient
Functionally the sedimentation island archipelago recreates the natural filtration process of the pond and slough. The planting across the islands, from the shore to the outer edge of islands, is the embodiment the historic South Florida land composition. The strategic planting across the islands is meant to be a visual expression of South Florida’s natural landscape transect.

Miami Vice
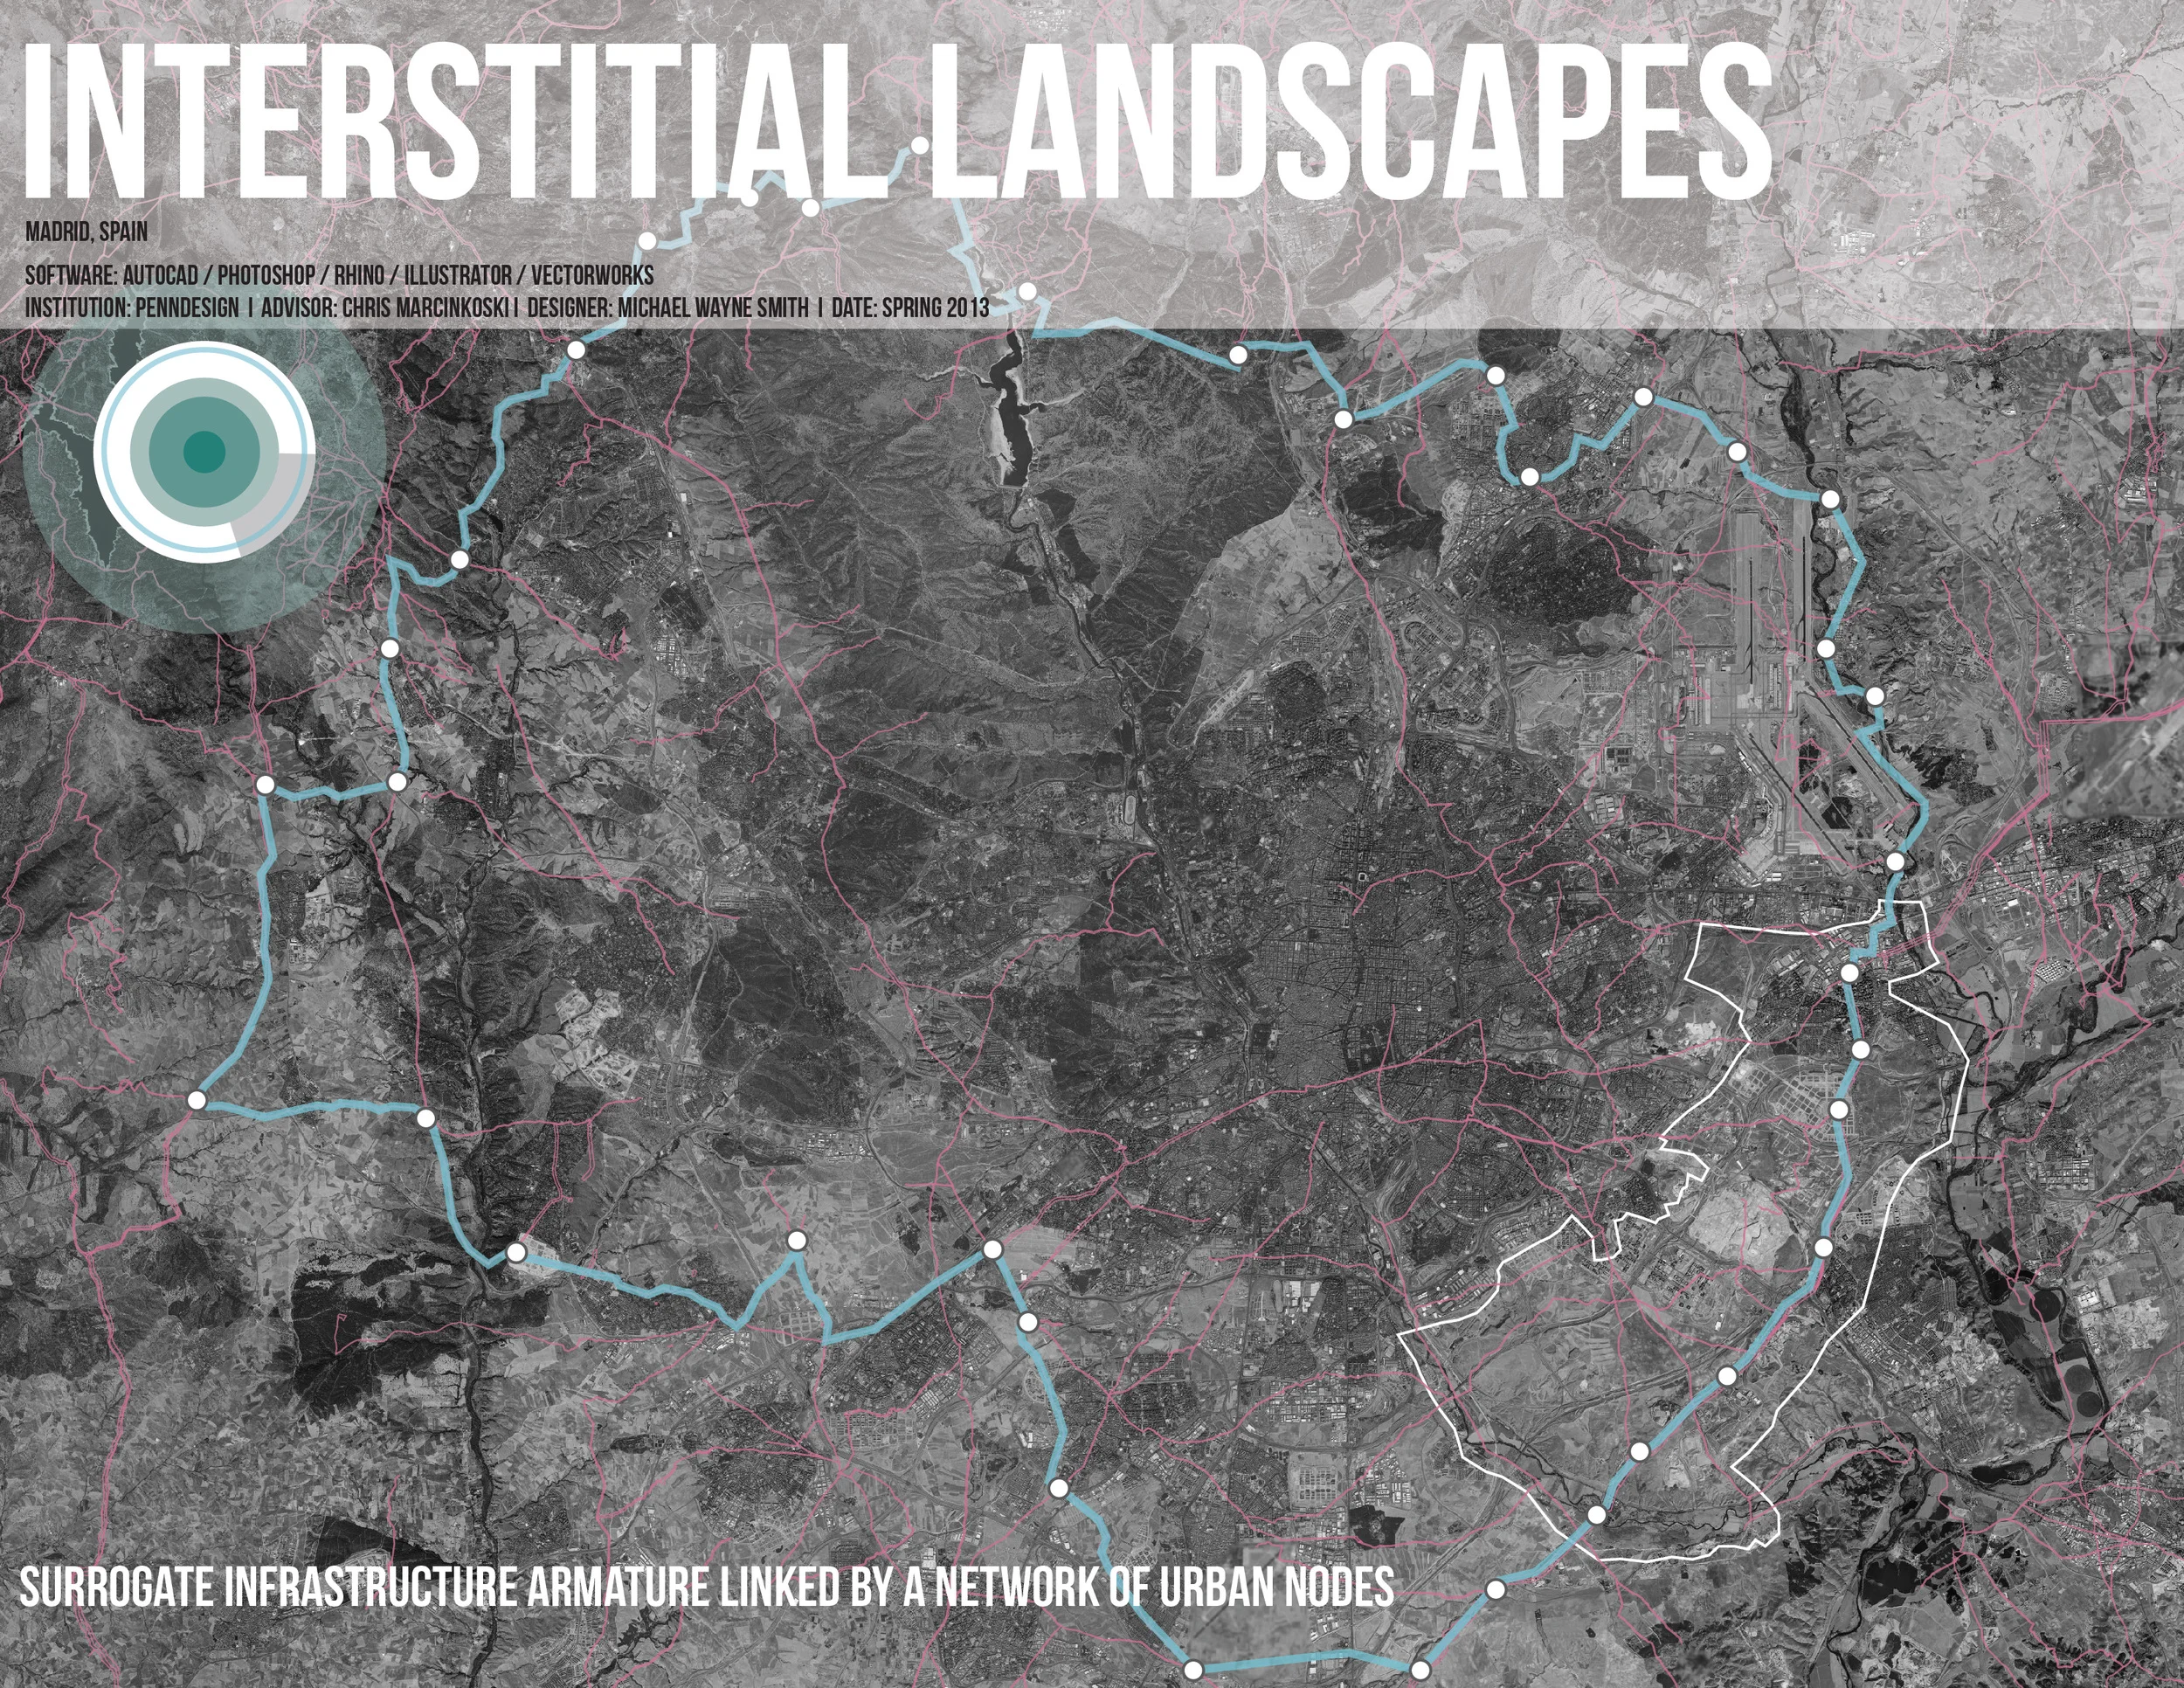
Interstitial Landscapes
This research takes the form of a design proposal for the urban crisis in Madrid, Spain. The preliminary investigation analyzes the physical and socio-cultural conditions of the abandoned and highly vacant residential projects on the edge of the city. The goal was to support the failing new residential developments, connect the existing neighborhoods and social classes segregated by modern infrastructure systems. The tool for providing this support and bridging these communities is the matrix of trails which stretch over 6,000 miles across the city. These historic farming trials (Vias Pecuarias) were once the dominant infrastructure in the city and it was at the intersection of the vias pecuarias from which every historic community derived. I’m investigating the potential of strategically developing new points of intensity along the remaining vias pecuarias to augment the urban and economic convulsions the city is currently experiencing. My solution takes the form of mixed-use hubs across the vias pecuarias; establishing a new armature that elevates the historic networks hierarchy amongst the contemporary infrastructure systems and serves the insufficient housing establishments while also providing jobs and basic services.
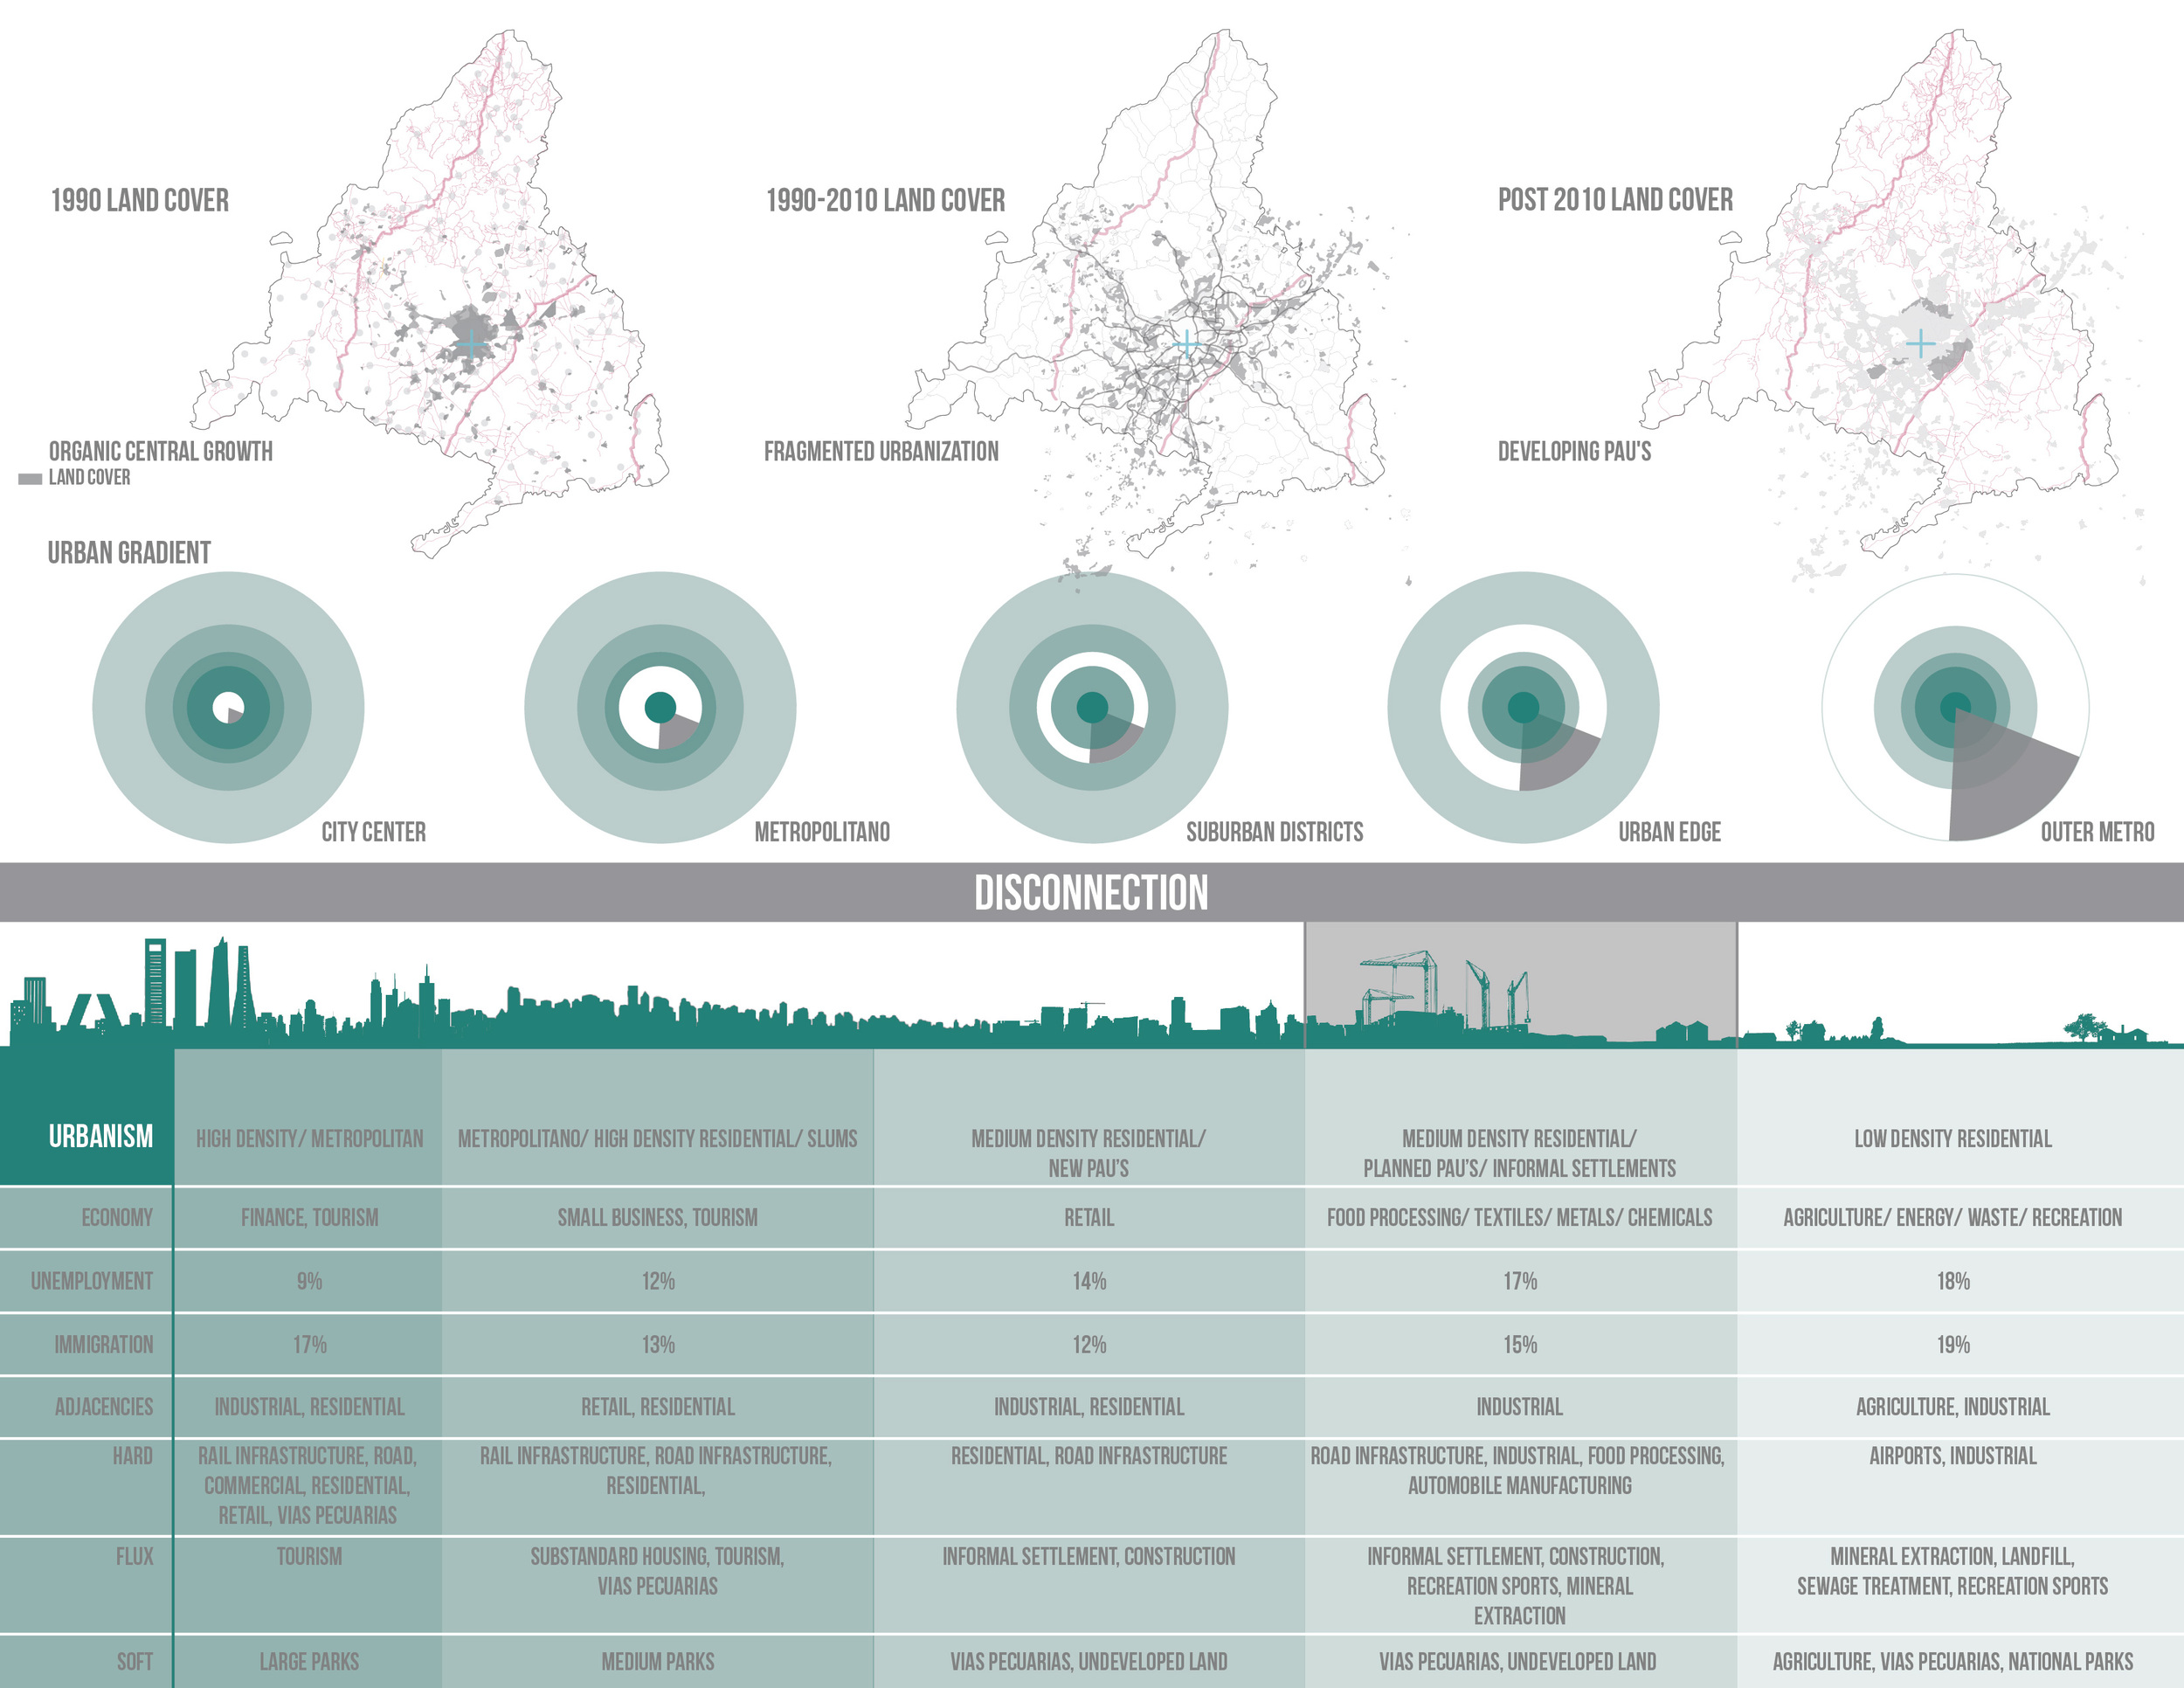
Fractured Urban Growth
Over the last 500 years Madrid has experienced an organic city growth from its urban core outwards towards the countryside. This natural development pattern, like many other early European cities, continued through the early 1990’s.
In the two decades preceding the EU financial crisis Spain has seen significant growth directly associated to transportation infrastructure and residential construction developments across the country. The abundant funds rapidly leant to developers lead to land grabbing outside of the city’s adjacent parcels. Despite Spain’s controlled debt level (unlike many of their troubled EU neighbors) a bubble connected with construction expansion popped and sent the country into a rapid downward spiral. This prompt collapse of the country’s economy left many of the PAU’s (residential developments) empty and disconnected from Madrid’s urban center.

Historic Cattle Trails: Vias Pecuaria
Historically Spain’s infrastructure was defined by cattle trails which traversed the country to move cattle and goods to pastures and markets. Today these vias pecuaria are largely unused but remain intact because they are protected by 500 year-old domain laws.

Canada Real
Amongst the matrix of cattle trails a larger infrastructure network was established to ensure national and international access to goods. These infrastructures are typically much wider and intersect major natural resources.
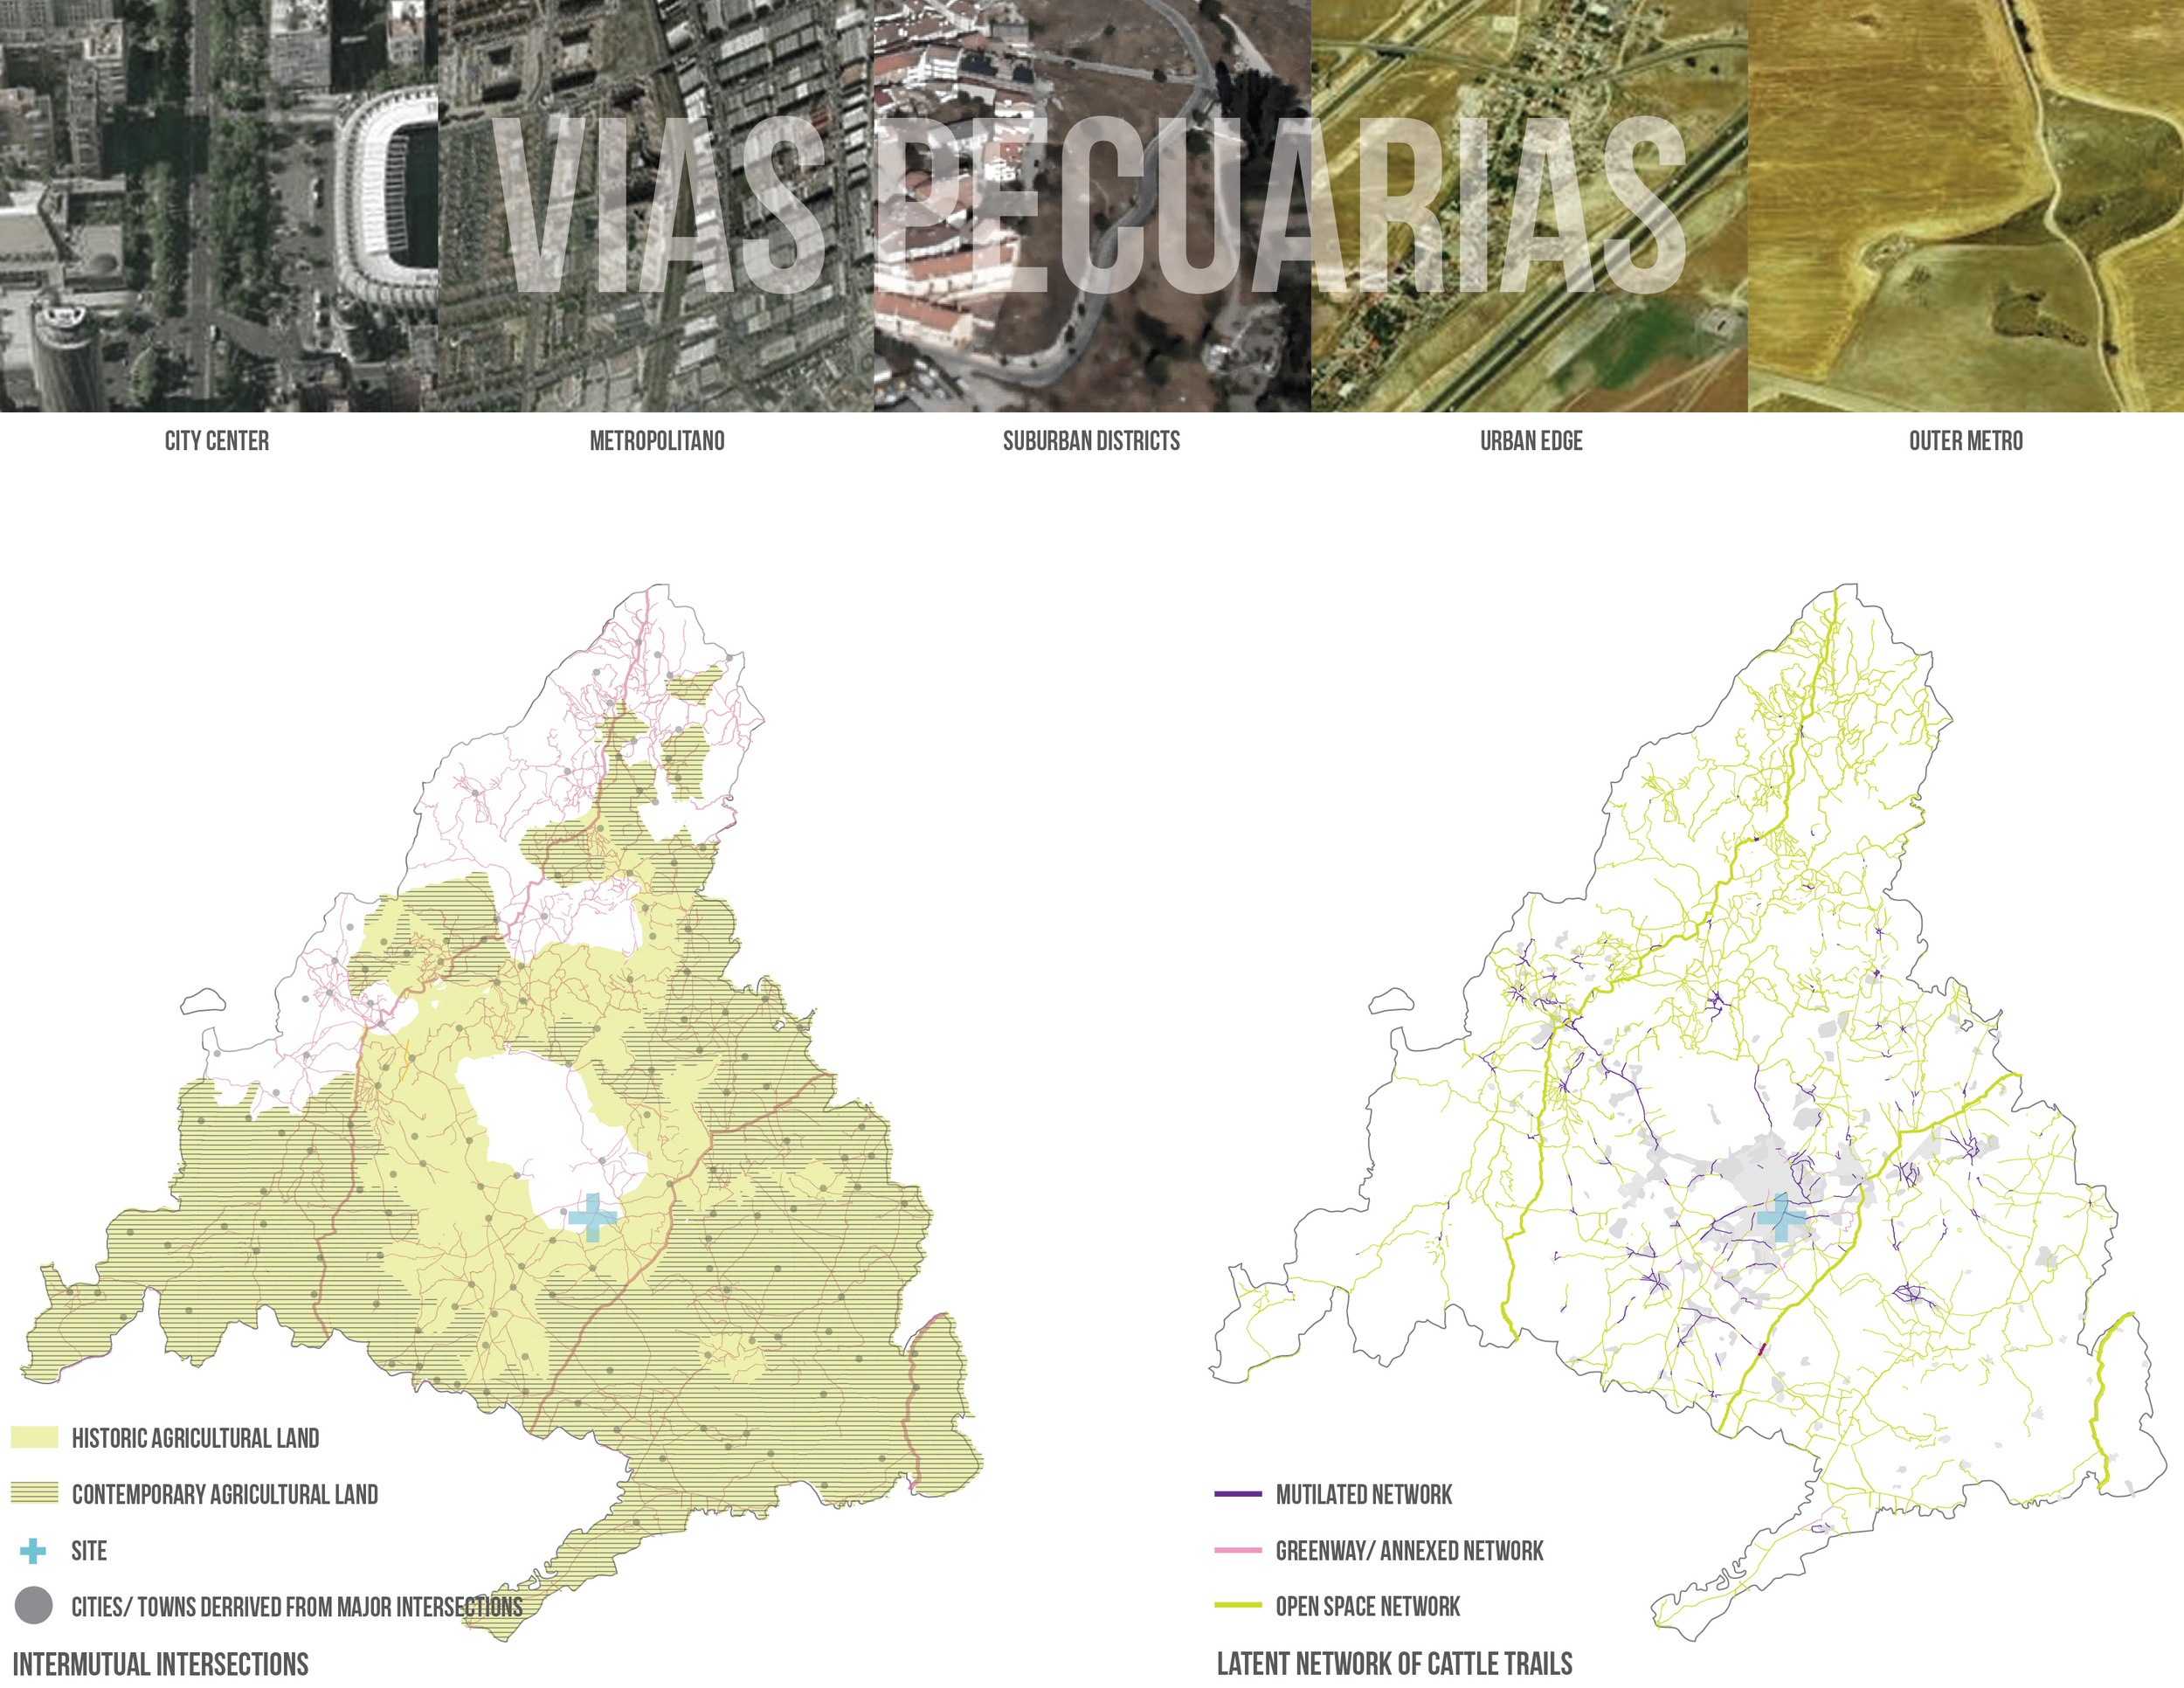
Historic Agricultural Network
Historically, the intersection of major vias pecuaria intersections formed major markets and in turn became towns and then cities.
Today the vias pecuarias and canada real remain protected by a 500 year old domain law. Some of the infrastructure has been augmented off by modern development but remains part of the contiguous infrastructure.
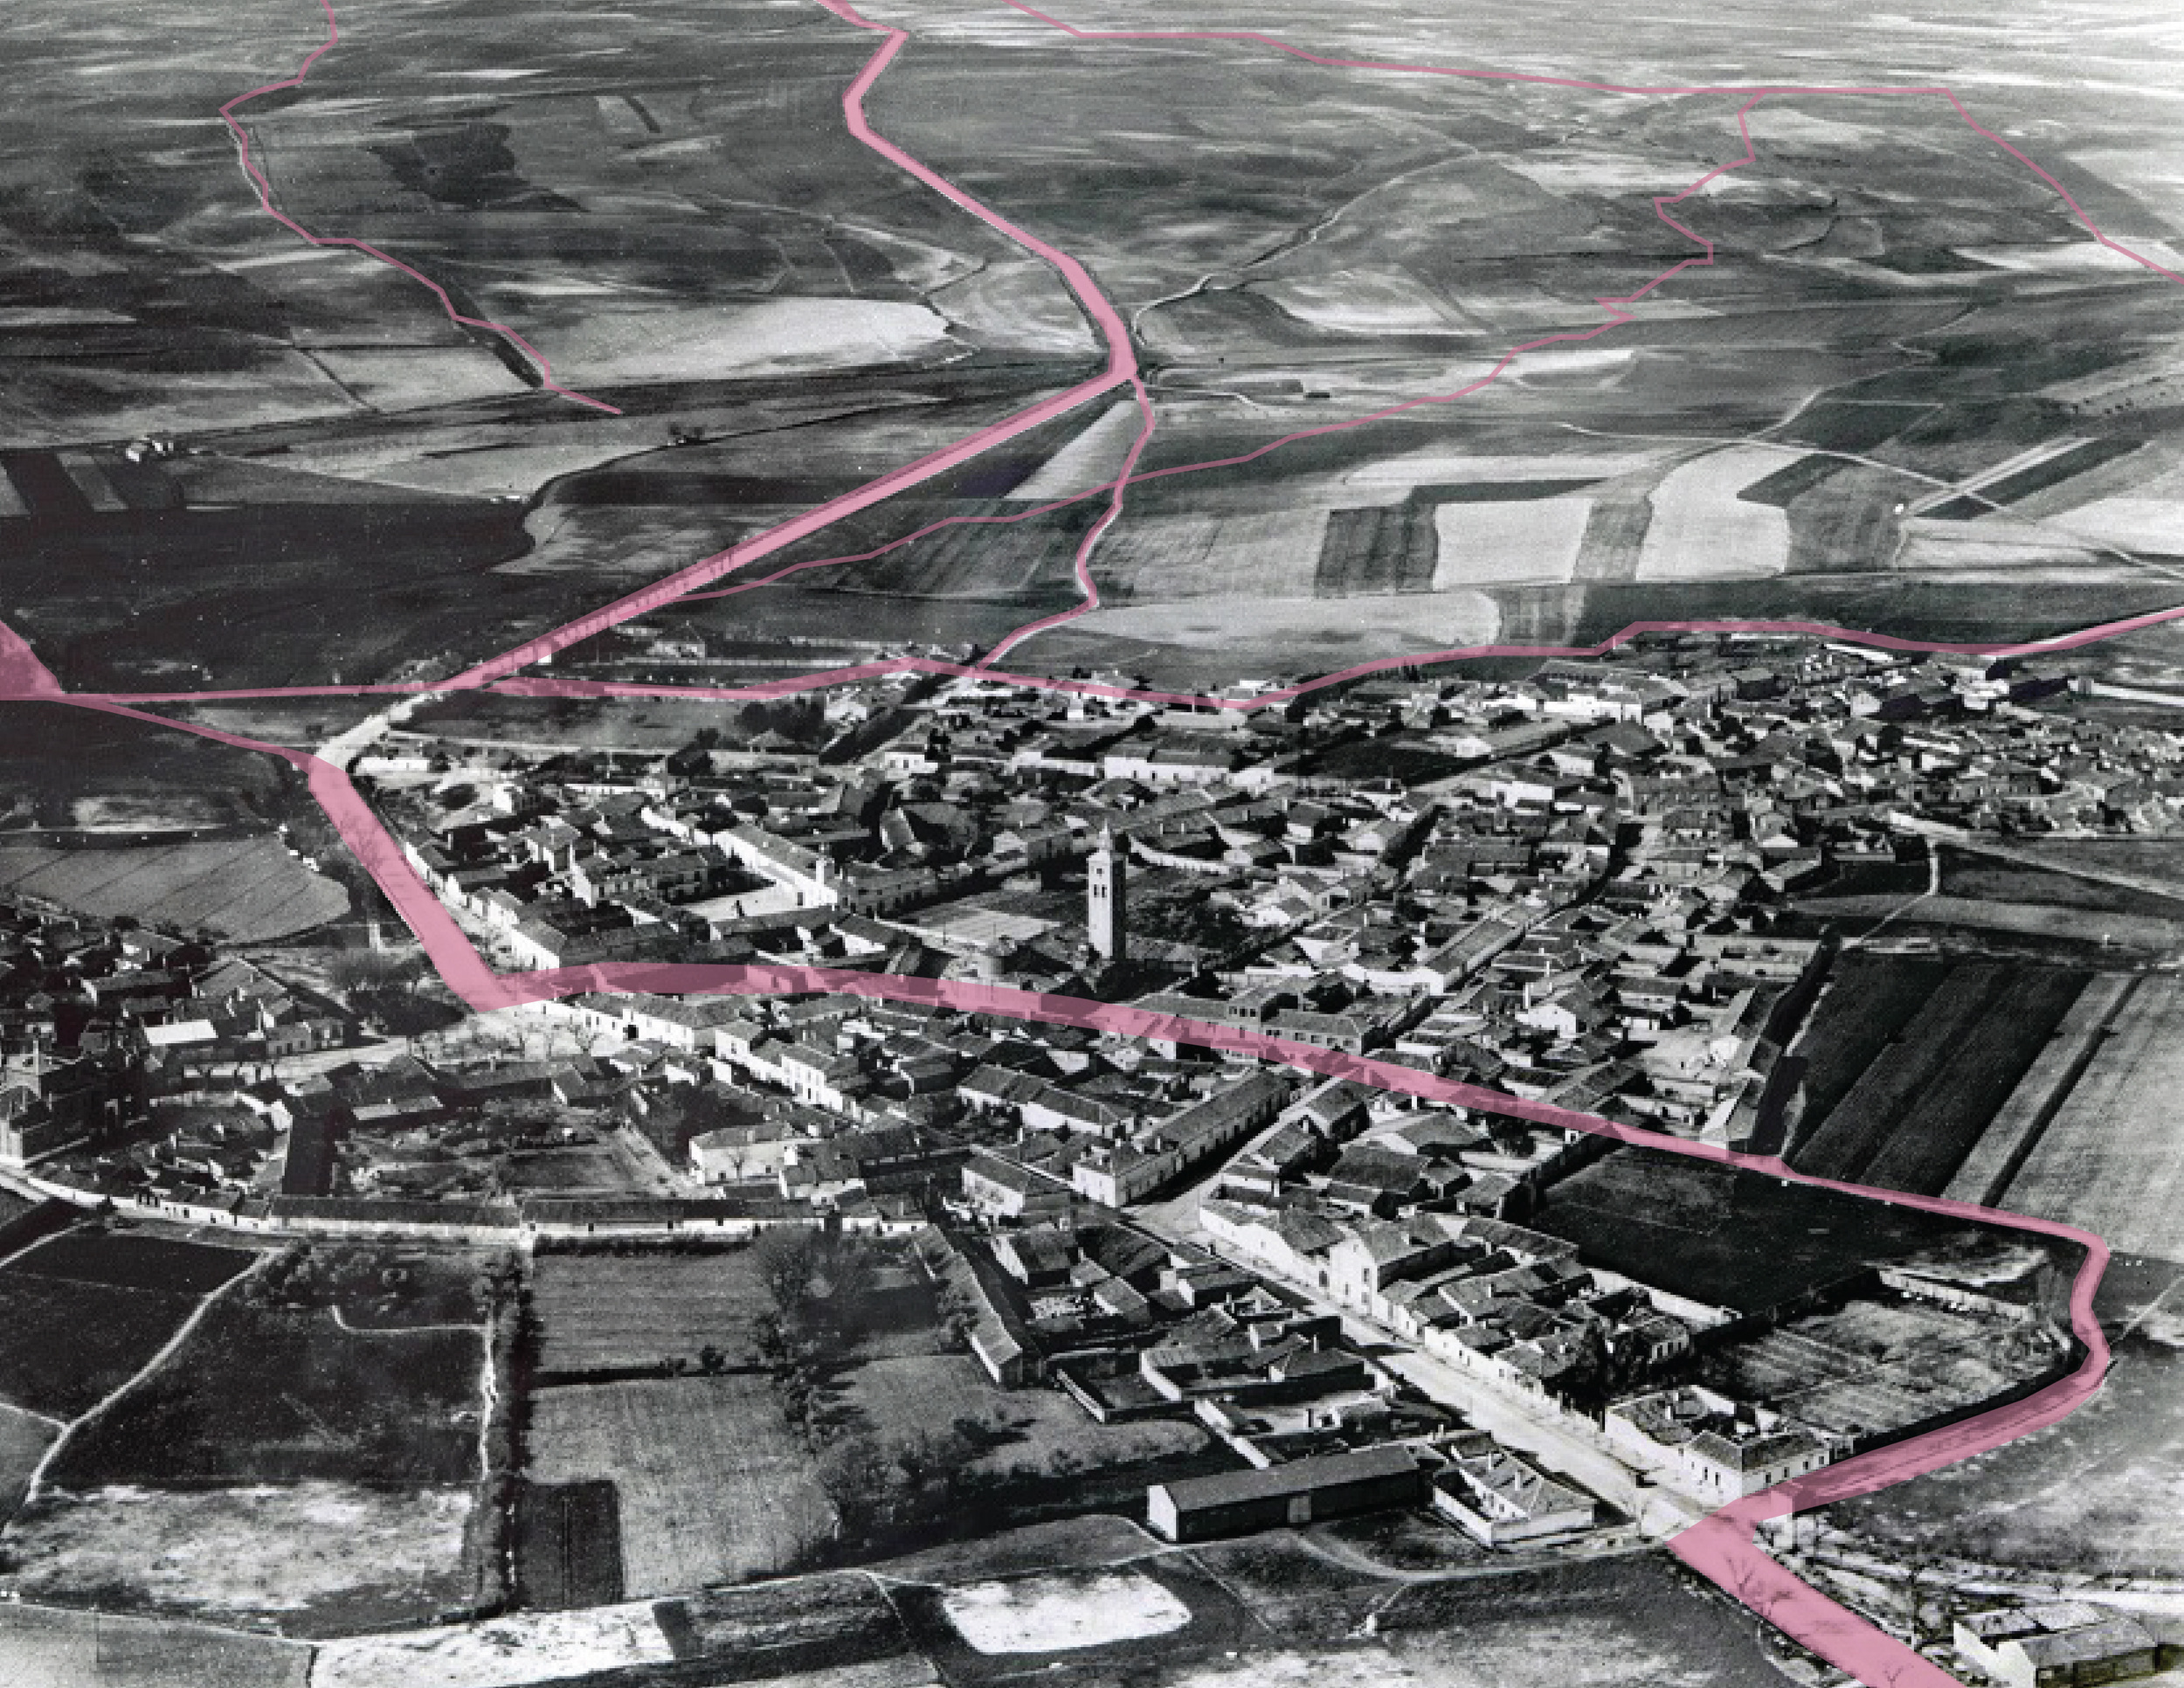
Mostoles, Madrid 1931
An example of city development around the intersecting infrastructure lines is illustrated here in the city of Mostoles. Here, like in many other modern cities, the intersection vias pecuarias became the framework from which the city developed.

Mostoles, Madrid 2012
In this aerial photograph the vias pecuarias in the city center have kept their original orientation but have been paved and modernized. Outside of the urban core the infrastructure remains a network of rural road which transport cattle and provides farm access.

Madrid Metropolitano
On the urban edge of Madrid abandoned PAU’s are placing a strain on the city and are limiting financial recovery.

Sesena Pau
Here is an example of an abandoned PAU on Madrid’s urban edge. Sesena was constructed at the height of the housing bubble. Today this community of 12+ storey residential towers is less than 10% occupied and disconnected from other urban developments.

Vallecas: Southeast Madrid
Sesena’s urban problems are eclipsed by the developments that began in Vallecas. Today entire community infrastructures lay dormant across the 28 square mile landscape. Here, because of the EU’s economic downturn, large unemployment rates and empty developments populate the district that was previously blossoming with development.
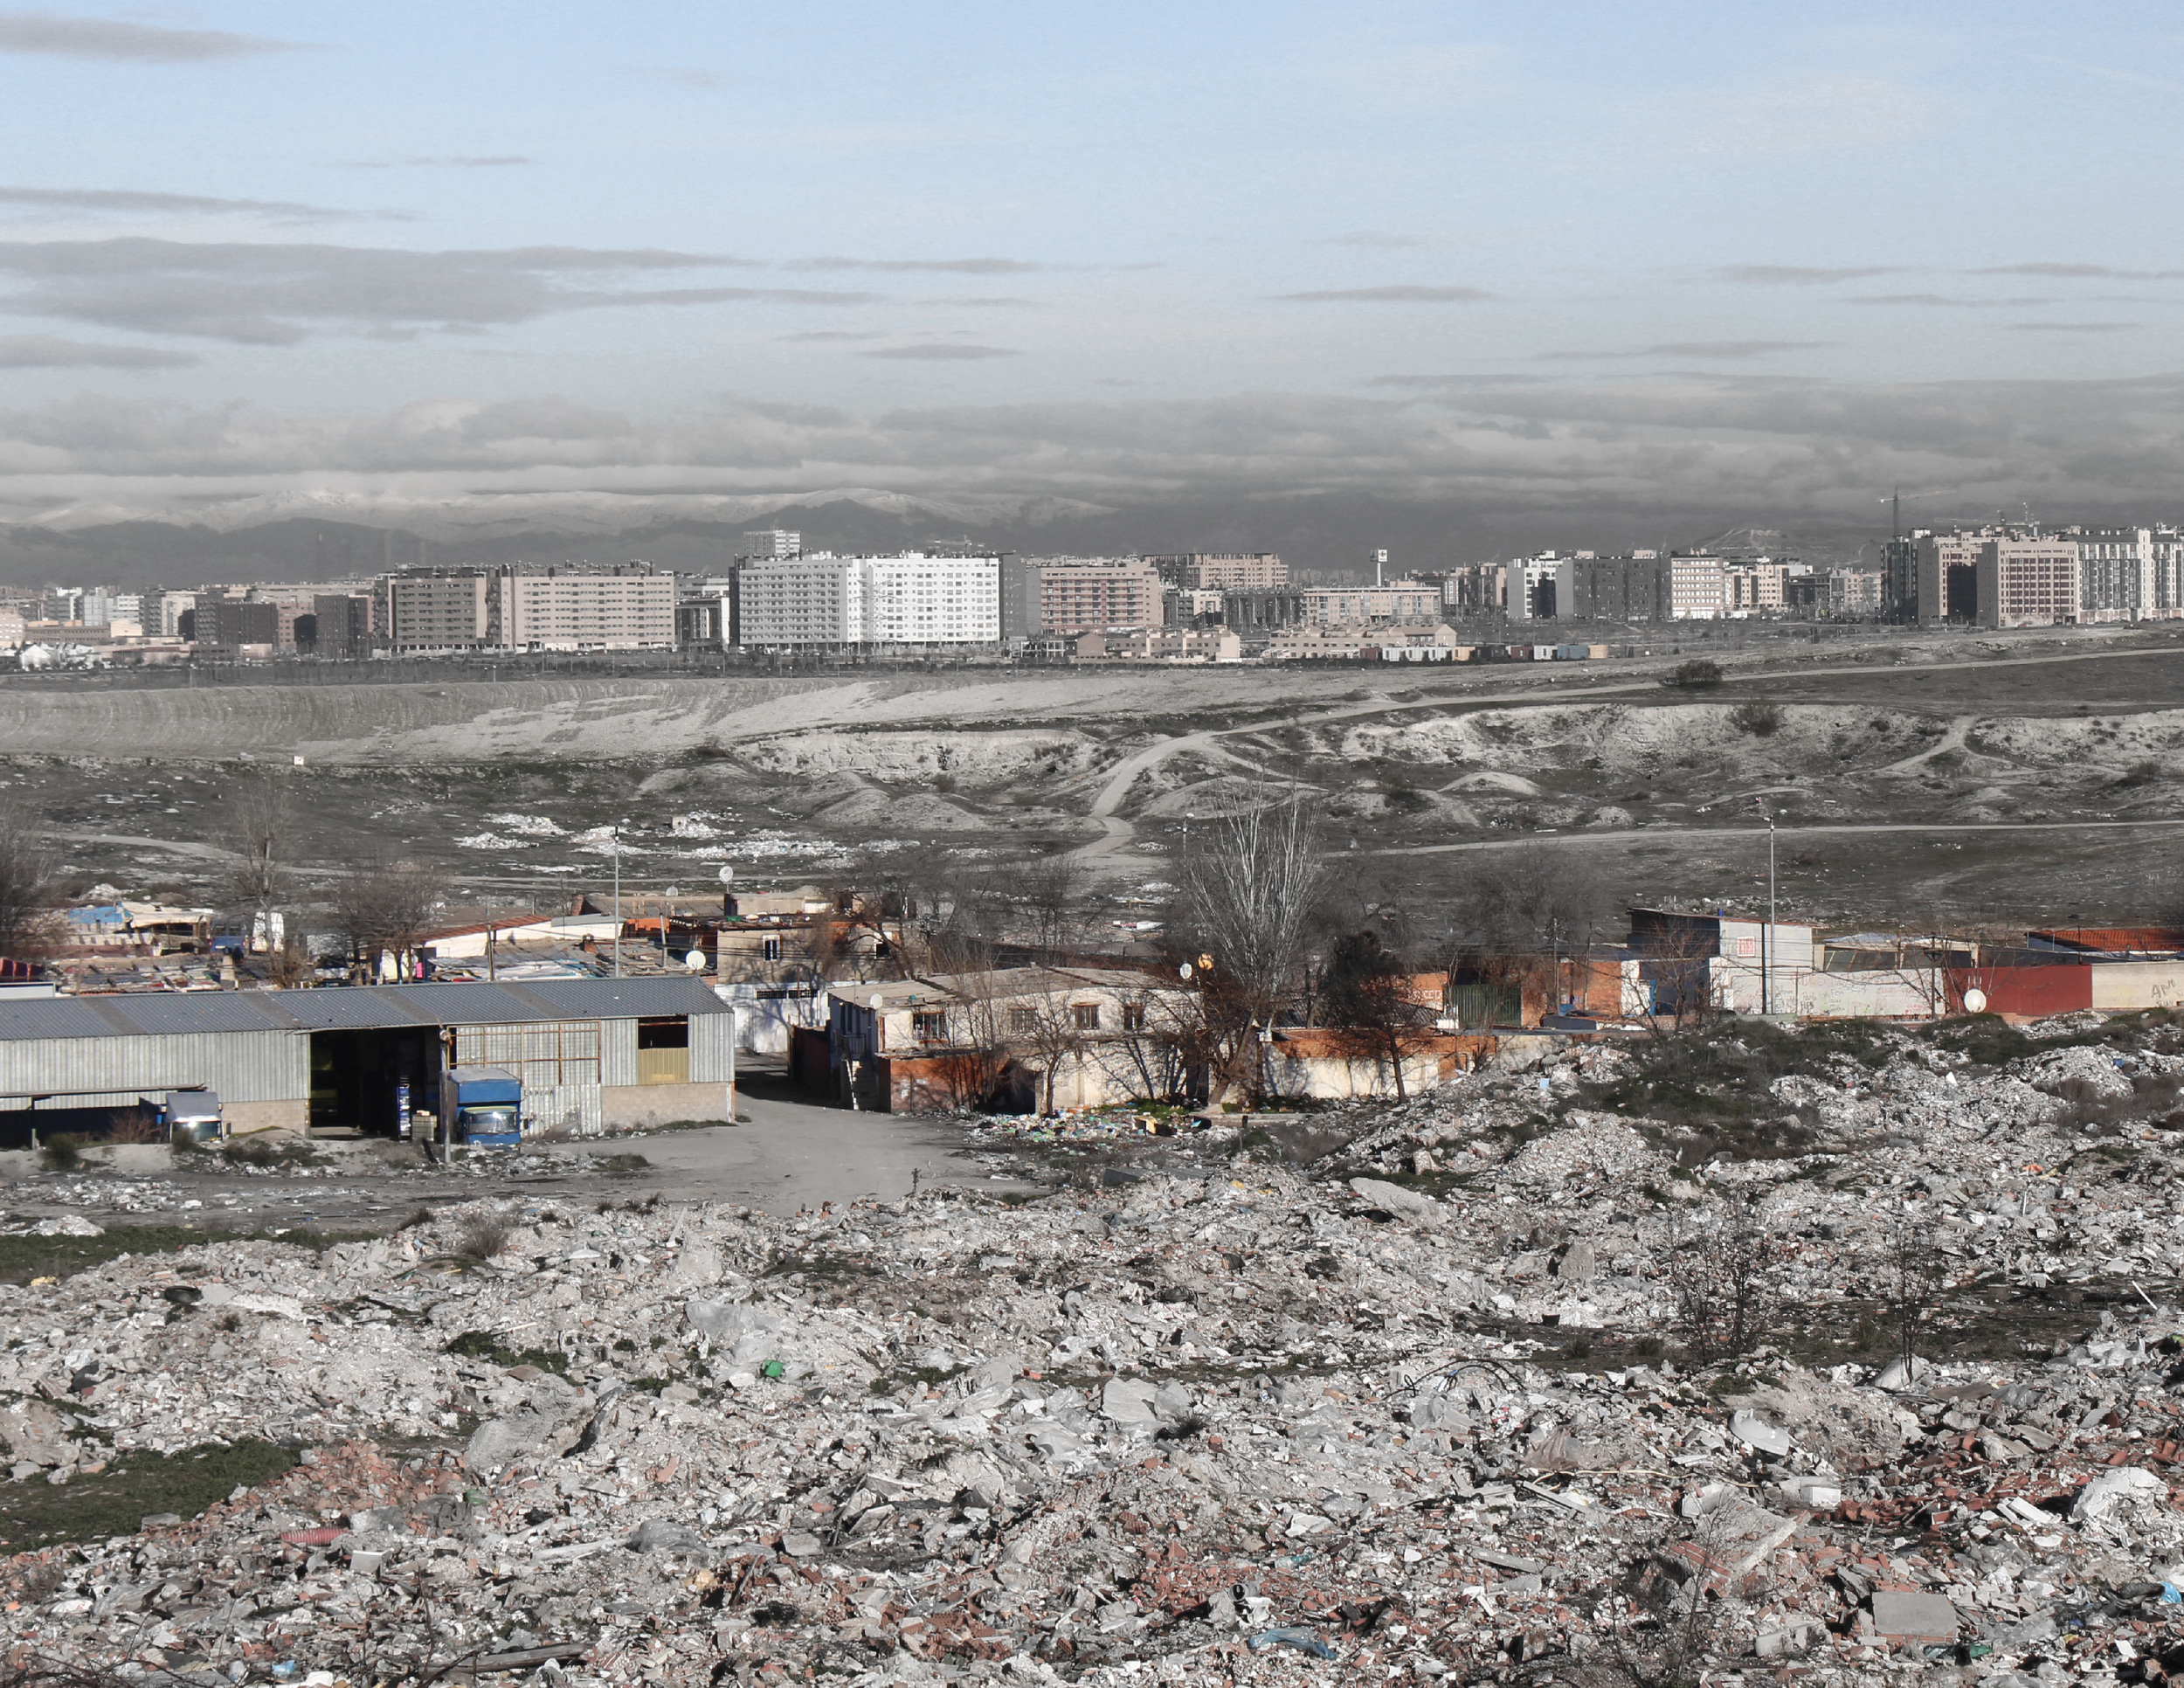
Urban Schisms: Waste Facility/ Informal Settlement/ Planned PAU Parcels/ Vacant PAU’s
This is the view approaching the city from the rural farmland outside of the urban edge. In the foreground the waste treatment facility, adjacent to is the largest informal settlement in Europe. Beyond the 30 mile interstitial settlement a large stretch of land with basic infrastructures sits ready for cancelled PAU developments. Beyond this land are the newly developed PAU’s and beyond that is the historic city.

Linking Cultural Nodes
One of the metropolitanos largest economic sectors is tourism. Madrid’s rich cultural and natural resources inspire tourist from across the world to travel to Spain’s capitol. Channeling this resource to support the this city’s zone of need could provide a foundation
The ecological, infrastructural and cultural hubs were filtered by selecting the nodes within the city’s struggling urban edge and adjacent to vias pecuarias. 37 Stations derived from this. Articulated strategically along the vias pecuatias, the network of stations formed a loop around Madrid.

Armature System Analysis
To better understand the network of vias pecuarias that support the 37 stations I developed a map that illustrates the terrain and its adjacencies along the 110 mile traverse.

Rearticulated Infrastructure Network
The original vias pecuarias were design with the terrain and access as organizing structures. Today these seemingly arbitrary cattle routes don’t mesh well with the more orthogonal grid of the city. If the minor vias pecuarias were re articulated in a way that incentivizes development and supports the larger canada real network it would supporting a contemporary way of living and buttress the historic infrastructure with use and preservation.
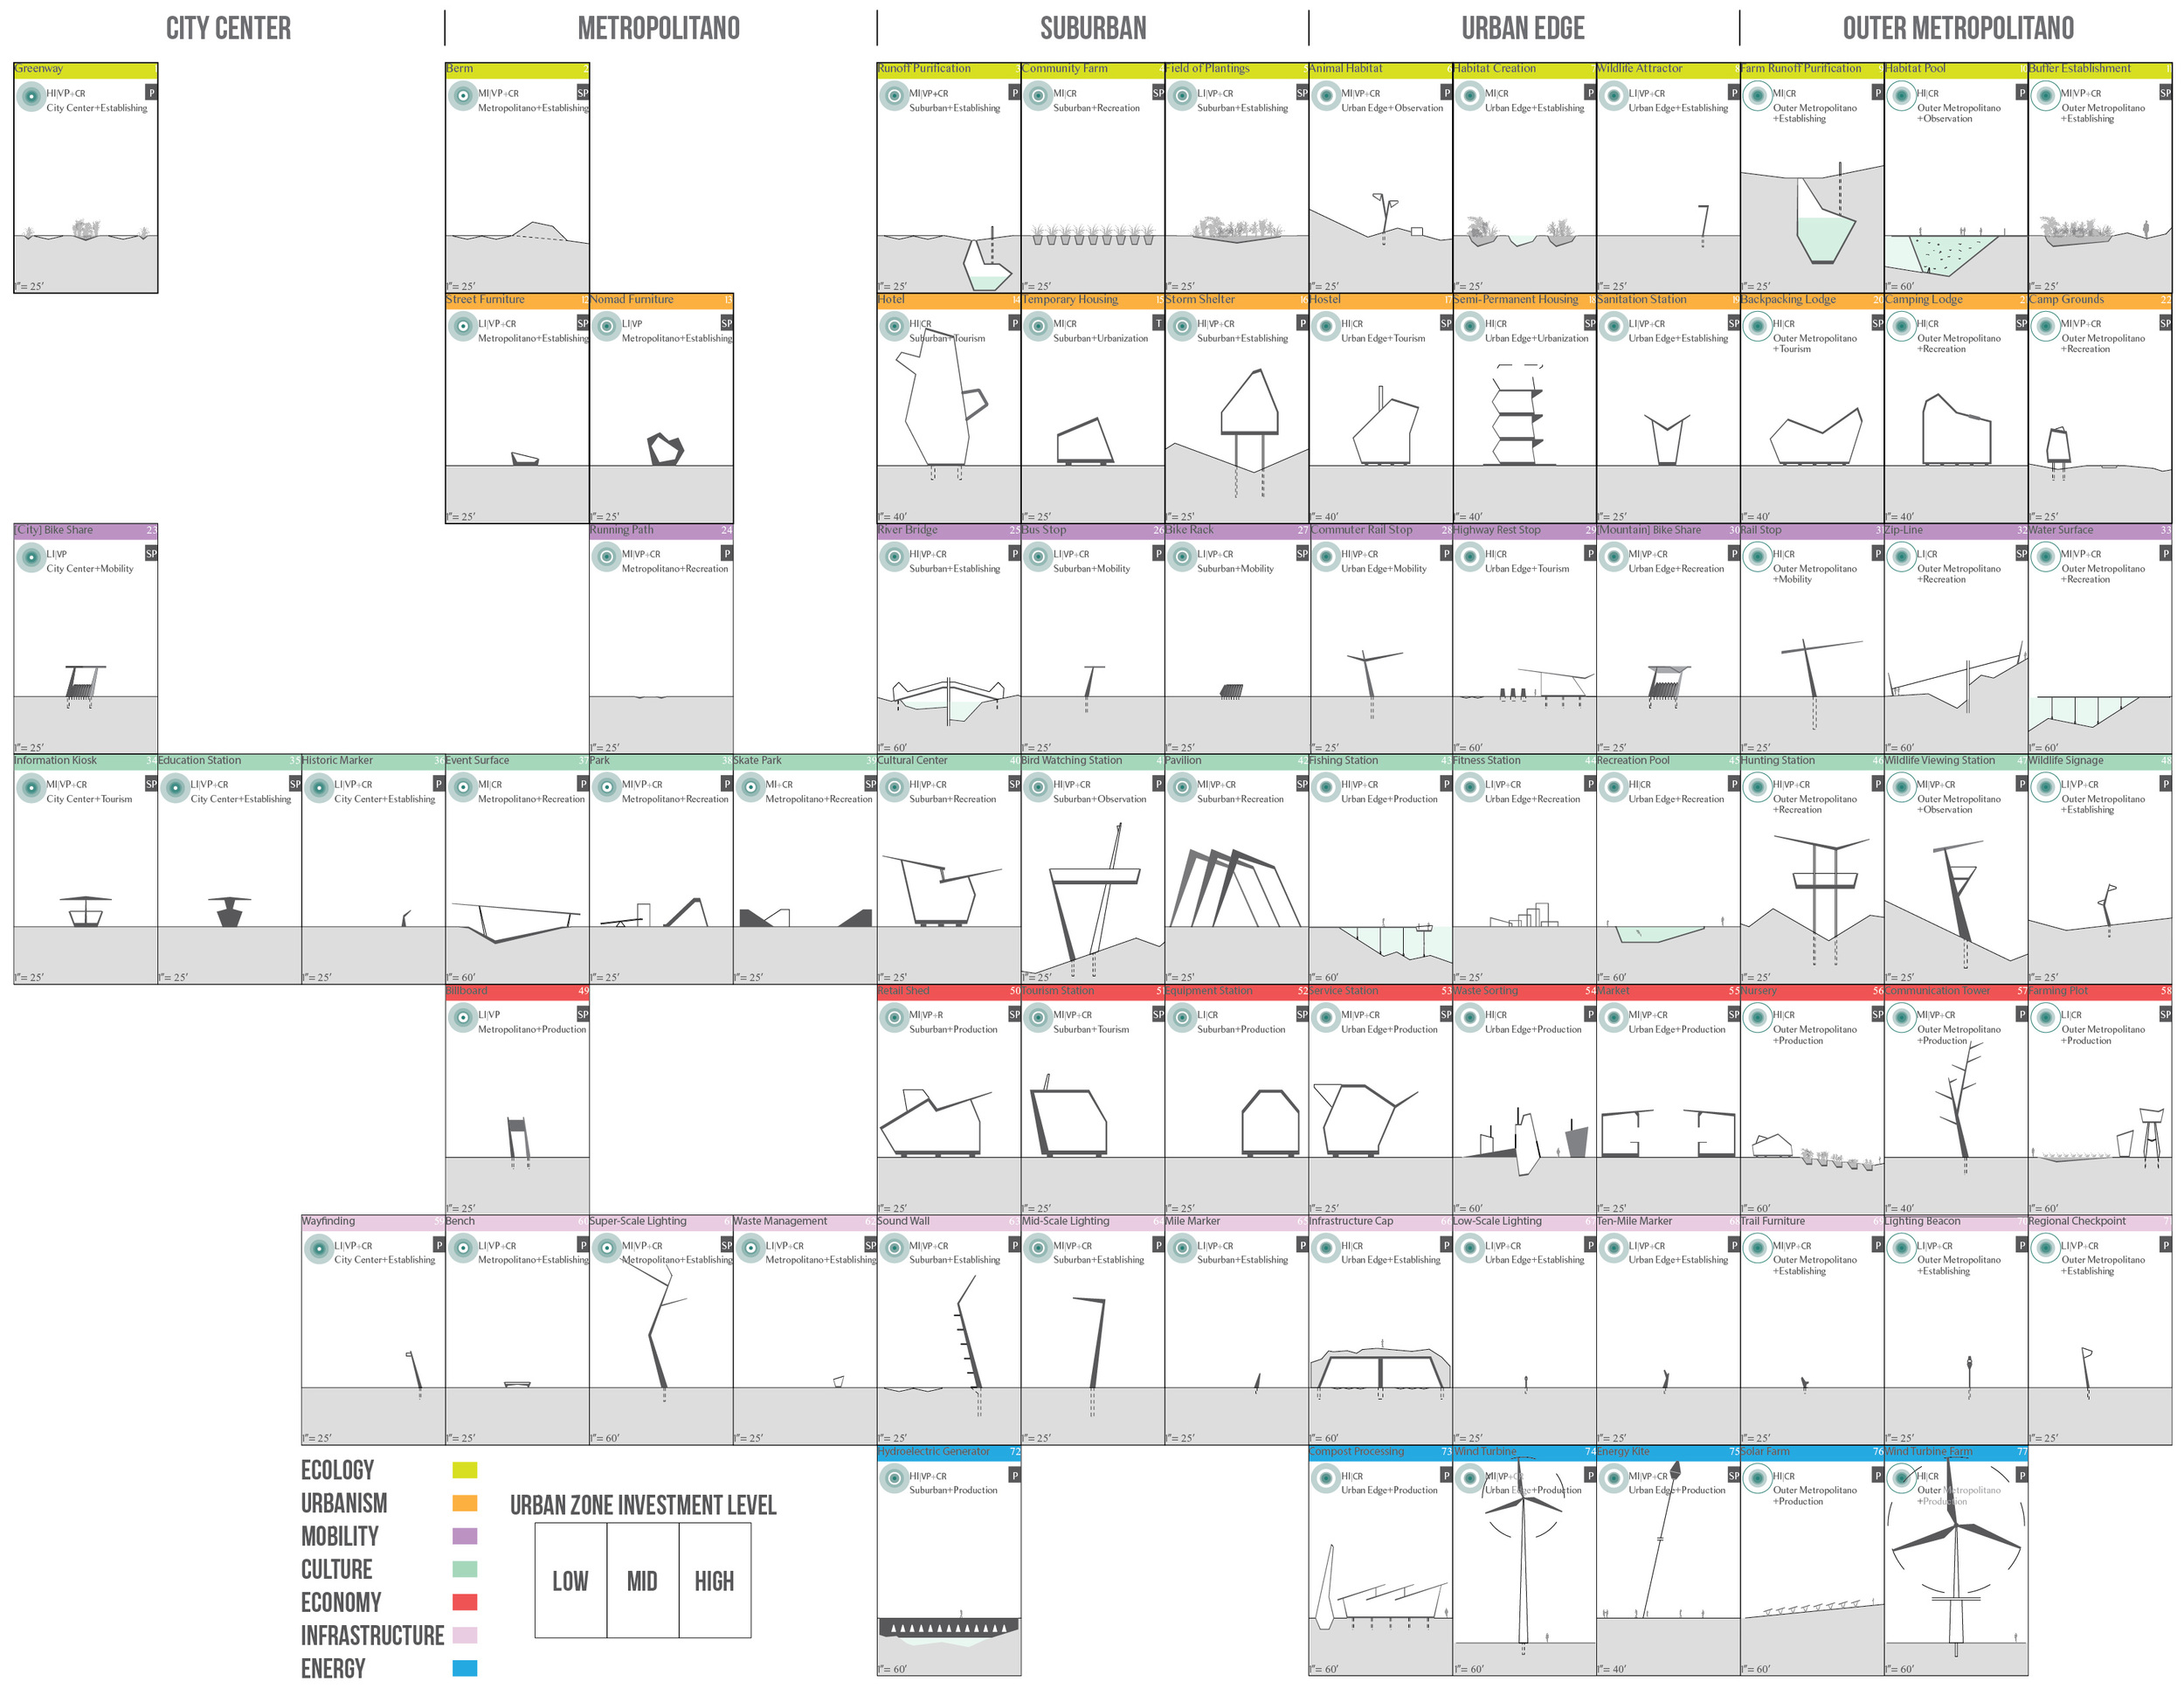
Kit of Parts
A kit of parts was developed to meet the different programmatic needs of the HUB’s across the varying landscape conditions. This palette of design interventions offers designed solutions with scale, region and cost in mind.

Vias Pecuaria Stations – Exploded Diagram
Each station is composed of several layers of core infrastructure. The station’s platform, greenway connections and components are strategically located within the vias pecuarias protected right-of-way.

Station 9
This station is positioned near a mature PAU development and alongside an existing stream. Camping lodges and fishing stations here will promote ecotourism.

Station 10
This station is adjacent to an abandoned farmland. Plots are developed along the vias pecuaria to restore the traditional use of the land. Turbines positioned here will produce power by taking advantage of the strong local currents.

Station 11
This station is developed near Europe’s largest informal settlement. Modular affordable housing units are provided to support the underserved community. Market sheds are installed to incentivize trade.

Station 12
Station 12 is near a developed PAU that is struggling to fill its occupancy and has a 17% unemployment rate. To stimulate the local micro-economy here retail sheds are installed to encourage local trade. Hostels are deployed on the site to encourage tourism.

Station 13
This location has a high unemployment rate and a need for construction housing for transient workers. Affordable housing here would provide both temporary and semi-permanent housing.


Edaphic Ecology
This investigation was centered on treating the polluted water in a channel between two piers on the Delaware River. The goal was to design a temporary structure to collect the pollutants between tidal exchanges.

Sedimentation Accretion Over Time
Baffles are positioned in locations within the channel where sedimentation naturally occurs. The baffles were designed with the bathymetry to maximize the sedimentation accumulation in the structure.

Site
The CSO outfall in the north channel is the source of the pollutants that the baffle structures were designed to treat. The abandoned pier is a future site for pedestrian recreation.

Channel Intervention
Each baffle structure will respond to the surface that it come in contact with. The angle for each baffle is determined by its position within the channel. The angles vary to collect the maximum amount of particulates while allowing the maximum water flow during slack tide.
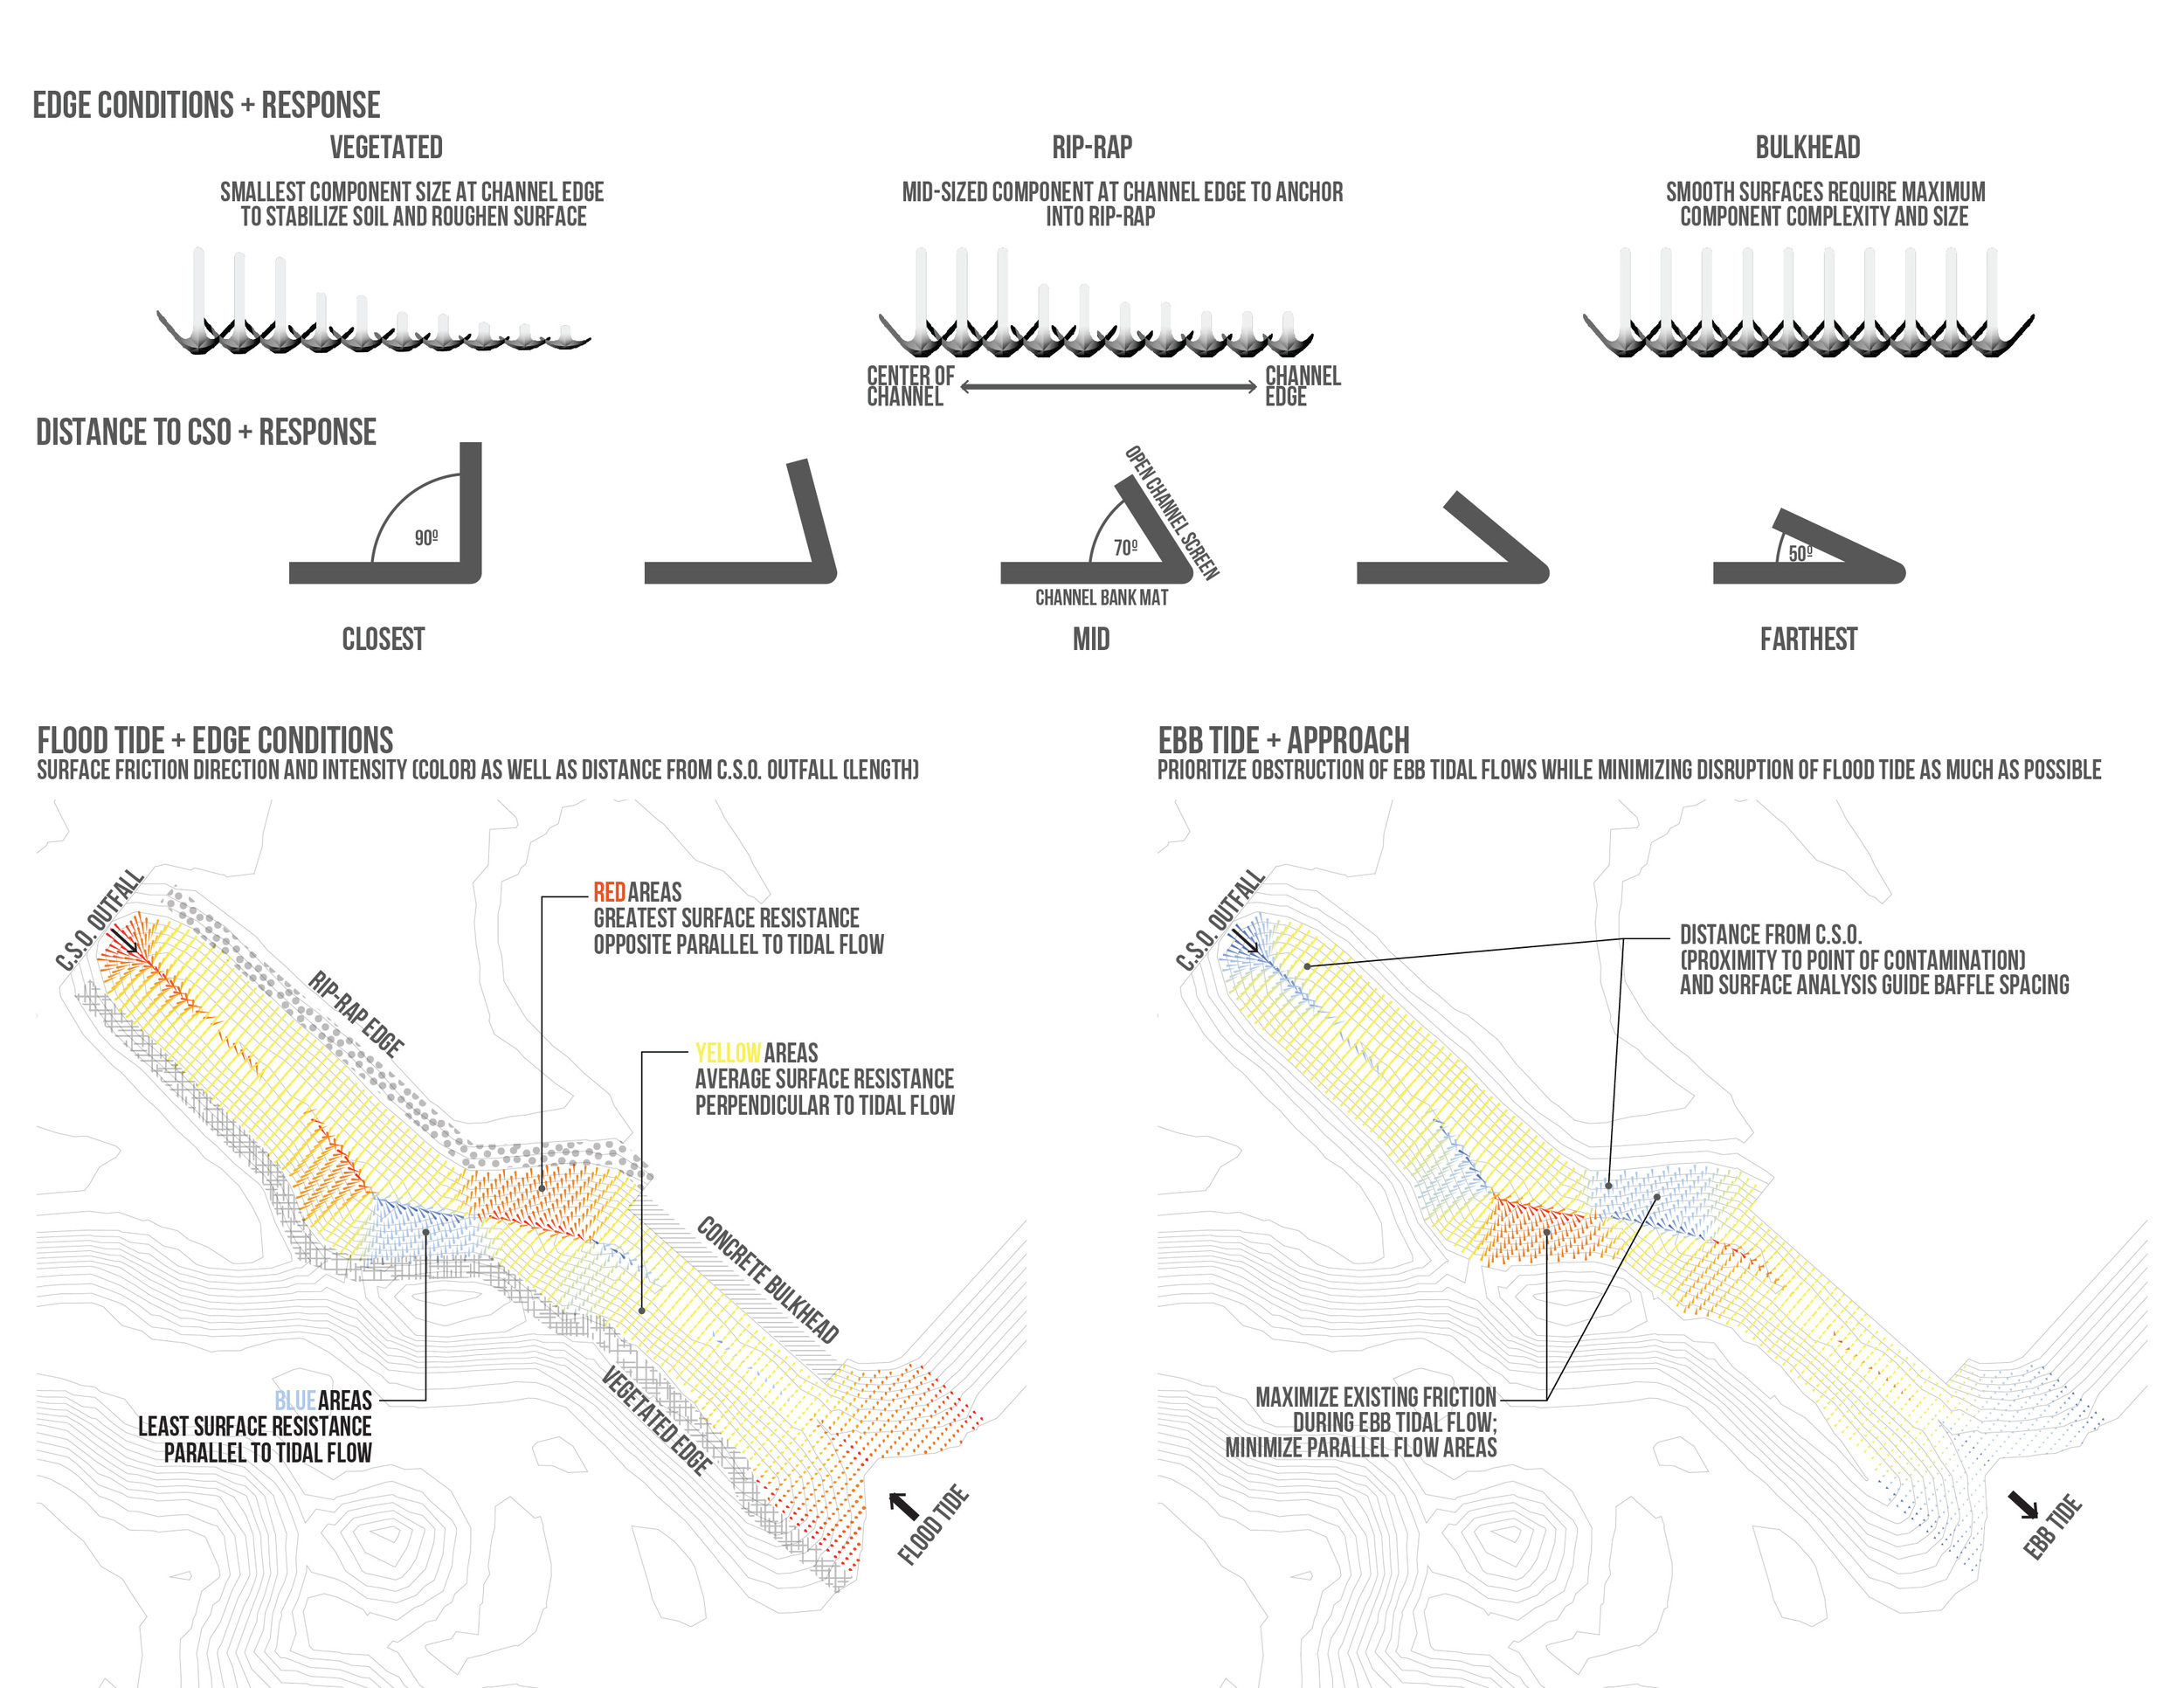
Responding to Bathymetric Conditions
This diagram shows how each baffle component and the accumulated baffle structure responds to the conditions in the channel.

Baffle/Component Structure
Each component and baffle architecture is complex; building this structure with conventional building materials would be very expensive. In lieu of this approach, geotextiles were selected as the primary building material because of their pliability, durability and cost. The components were made to interlock to reduce the need for hardware.
Over time the baffle structures will serve as host to aquatic and avian wildlife along the pier. A diagram of the water flow around the component and sedimentation collection from the CSO outfall can be seen in this Video Link.

Physical Component

Component Cluster

Baffle

Baffle

Baffle Construction

Edaphic Ecology

LightxSoundxMotion
Advanced computation techniques were used in exploring the light, sound and motion across a field in one hour. These three values were the operational mechanisms chosen because of their phenomenological influence on spaces. To represent the physicality of these values a 10 minute chunk was extracted from the dataset and extruded vertically to illustrate the intensity at specific points in the field.
The ultimate goal for this investigation was to find an alternative method into the design process. The transformation of recorded data constructs was the method used to guide physical form in this inquiry.

Notational Matrix
Algorithms were developed to translate the captured information and transform them into digital values. Next, the values were sorted and normalized then they were extruded into quantifiable factors. The result was a physical representation of the passive and invisible forces acting across the site.

10x10 Physical Representation
Acrylic was the material chosen the display the results of this inquiry.

10x10 Physical Representation
The original light values captured were projected back on the physical model generating a Meta feedback look.

Geometry Feedback
The model created from original values became the agent that filtered addition site information. These values were recorded and filtered through the digital matrix where they were derived. The result was an amplified tessellation, creating new ground.

Operational Matrix
Operable logics were extracted and synthesized from the feedback study providing a blueprint of translations through the evolution of the new digital model.

Pseudocode
The pseudocode diagrammatically outlines the total system (inputs, outputs, operations, etc.)

LightxSoundxMotion

Deployable Ecologies
Waterfront access is becoming more demanding in Philadelphia’s Penn’s Landing district. The polluted waters stifle growth and access here. Deployable Ecologies is a project that aims to help with these problems by turning them into opportunities for growth.

Site/ Combined Sewer Overflow Locations
The seven CSO points in the Penn’s Landing District are illustrated here along the Eastern edge of Philadelphia on the Delaware River.

Component Fleet
The intervention will consist of a set of aquatic components that work together to reduce the environmental impact of the CSO discharge. All components are orchestrated by a mothership.

Typical Deployment Structure
The mothership serves as a docking station to charge the aquatic components and also serves as host, offering programmatic spaces for recreation. The next set of components is the “Class A” components that form a chain to filter the fouled waters discharged from the CSO. “Class B” components support “Class A” components by acting as a buffer, protecting the water channel from the surging waters between tidal cycles. The last component class, “Class C”, serve as larger habitat ponds to support native ecologies.

Deployed Component Typologies
The Class A component has several subclasses to serve different bathymetric conditions and to also support multiple types of ecosystems. Small motors inside the component structures propel the modules in the river and channels.

Component Ecology
Class A components sequentially accept waters with high fecal levels. At the base of the component, charcoal and sand layers filter the water within the component‘s bladder, reducing the volume and level of polluted water that is expelled into the Delaware River. The Fecal matter deposited into the bladder is host to the fauna and other aquatic organisms, which breakdown the contaminated particulates. Overtime the bladders may become impermeable and need to be replaced to function efficiently.
The Habitat Ponds are programmed with different native ecosystem typologies and are left to evolve naturally. The ponds are designed to encourage wildlife activity off the shore and create a spectacle to promote visitation and tourism.

Mothership
The motherships are designed to host 20-40 pedestrians each. Most have unique programing to offer a variety of programmatic options. The vessels are also designed to link together to host larger events.
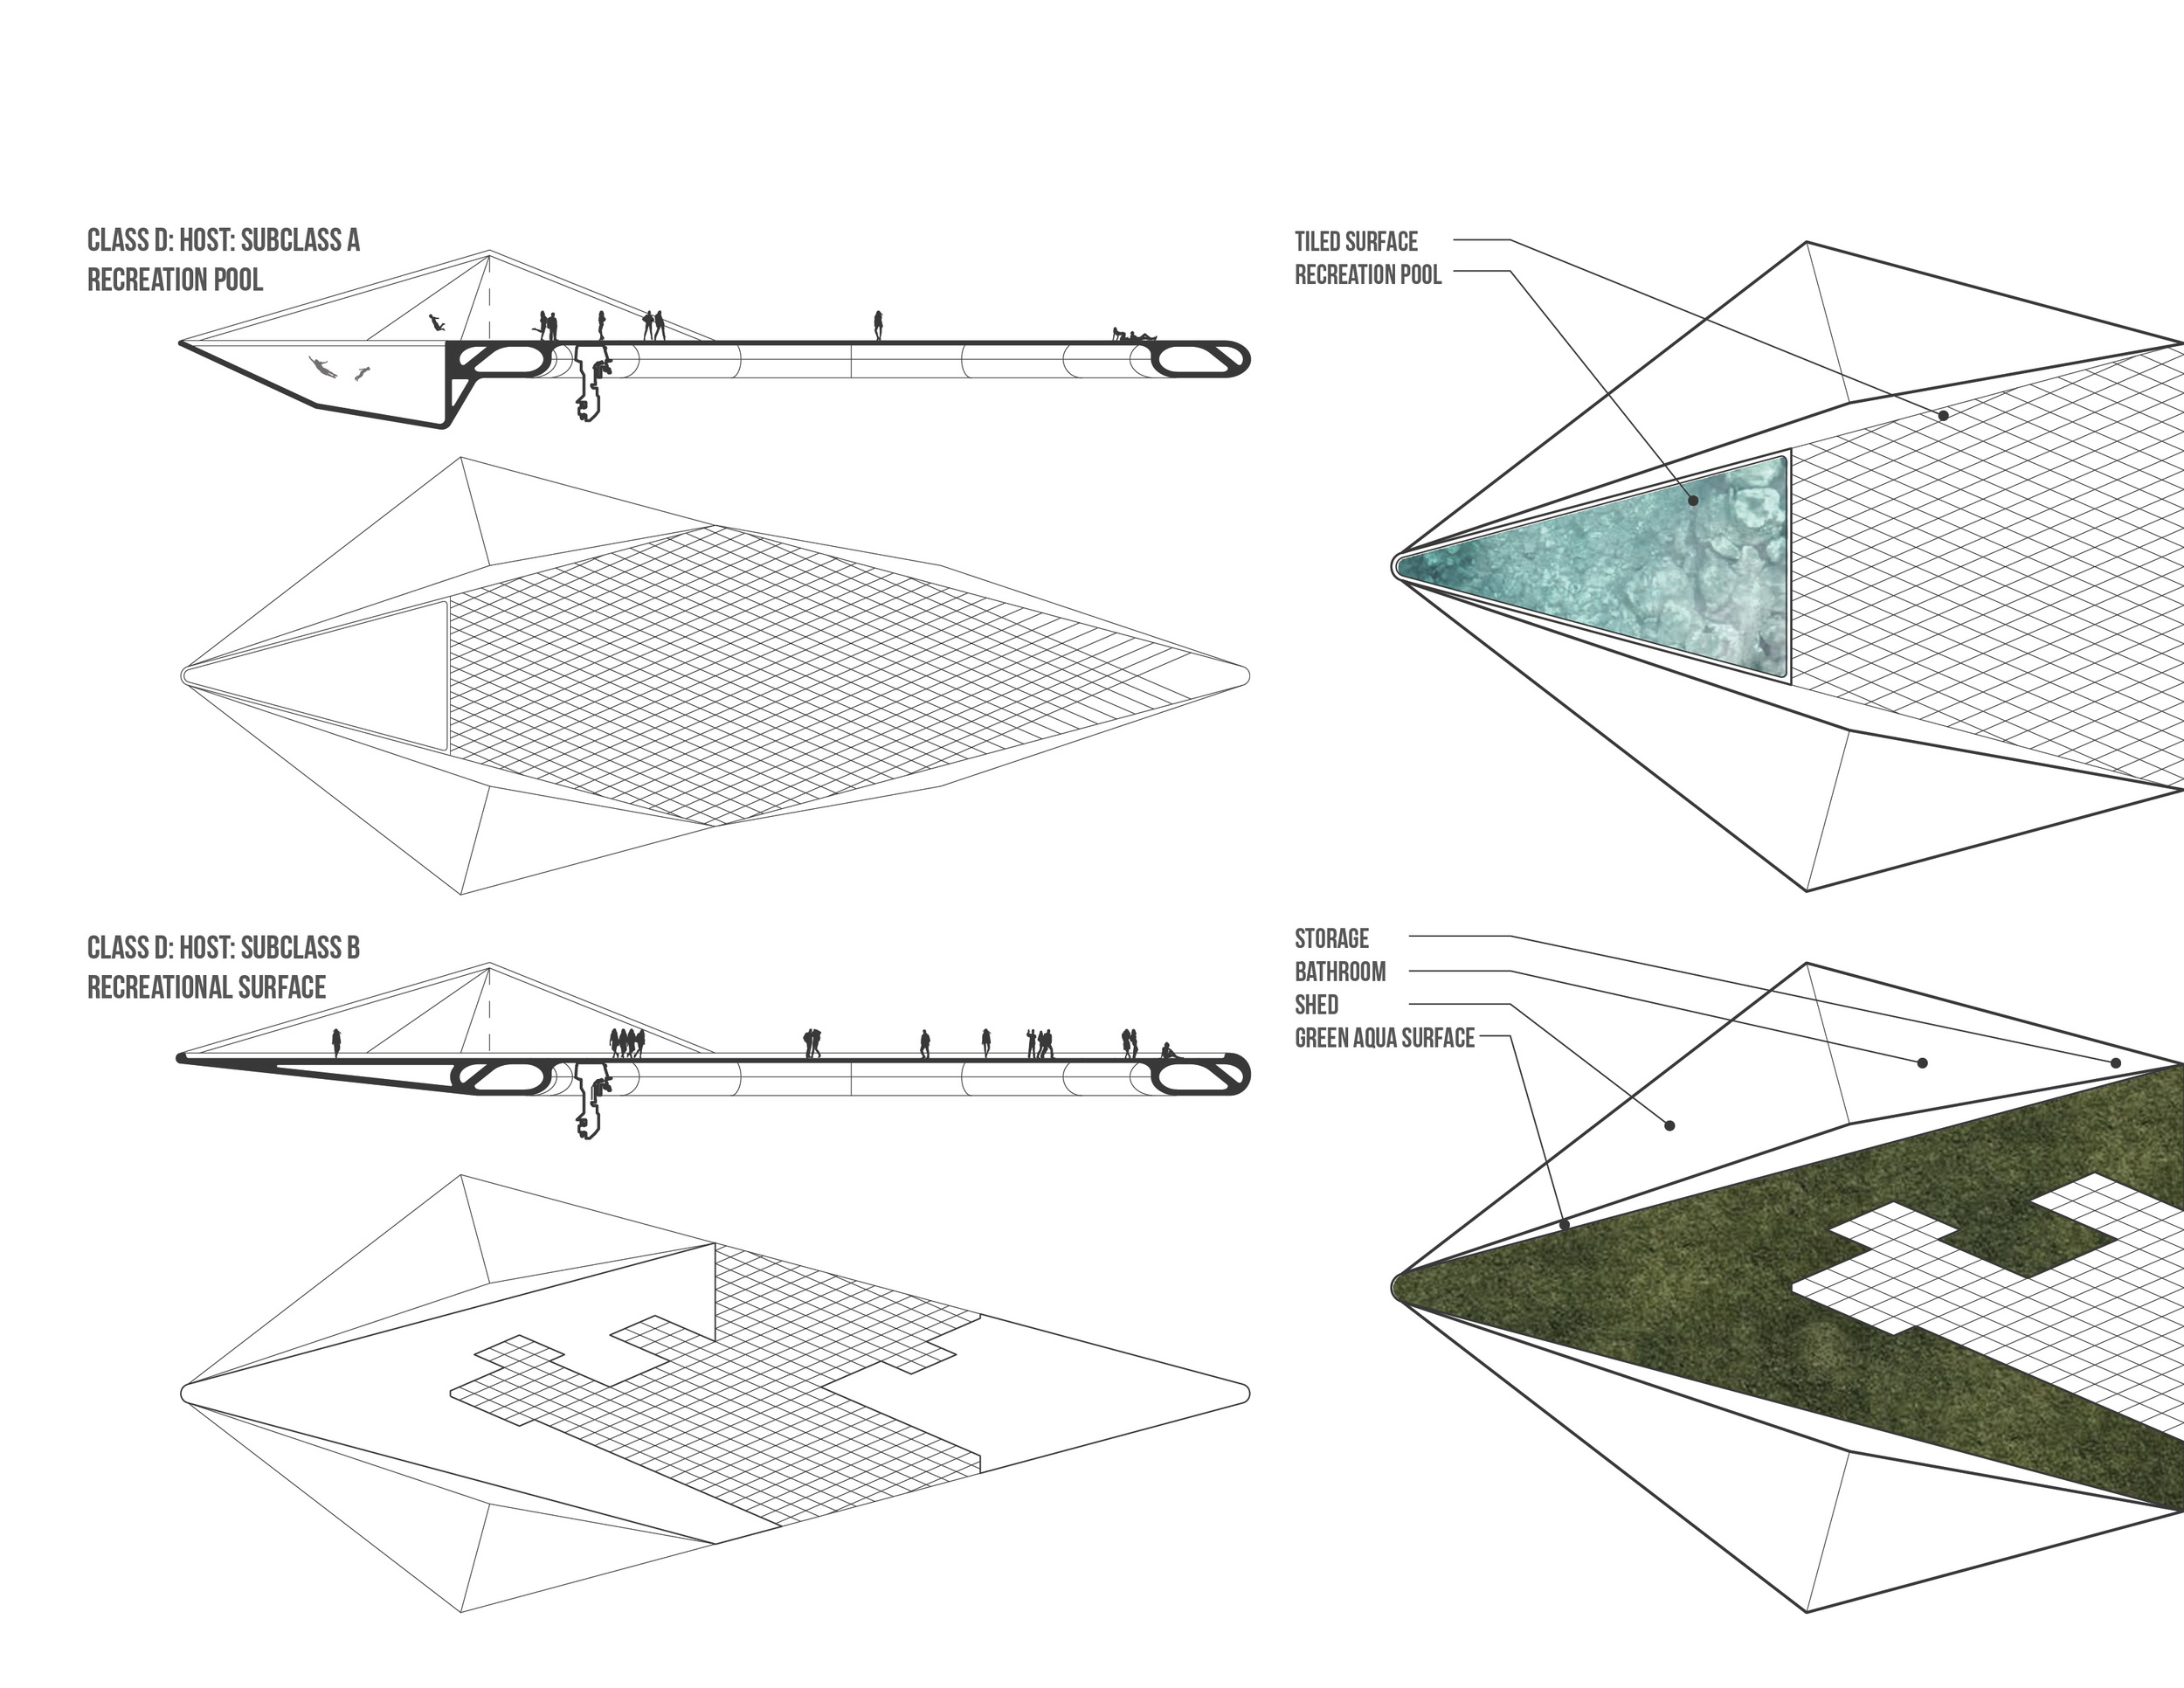
Mothership Component/ Recreation Space
Several mothership subclass typologies are illustrated here to suggest the programmatic potential of these aquatic vessels.
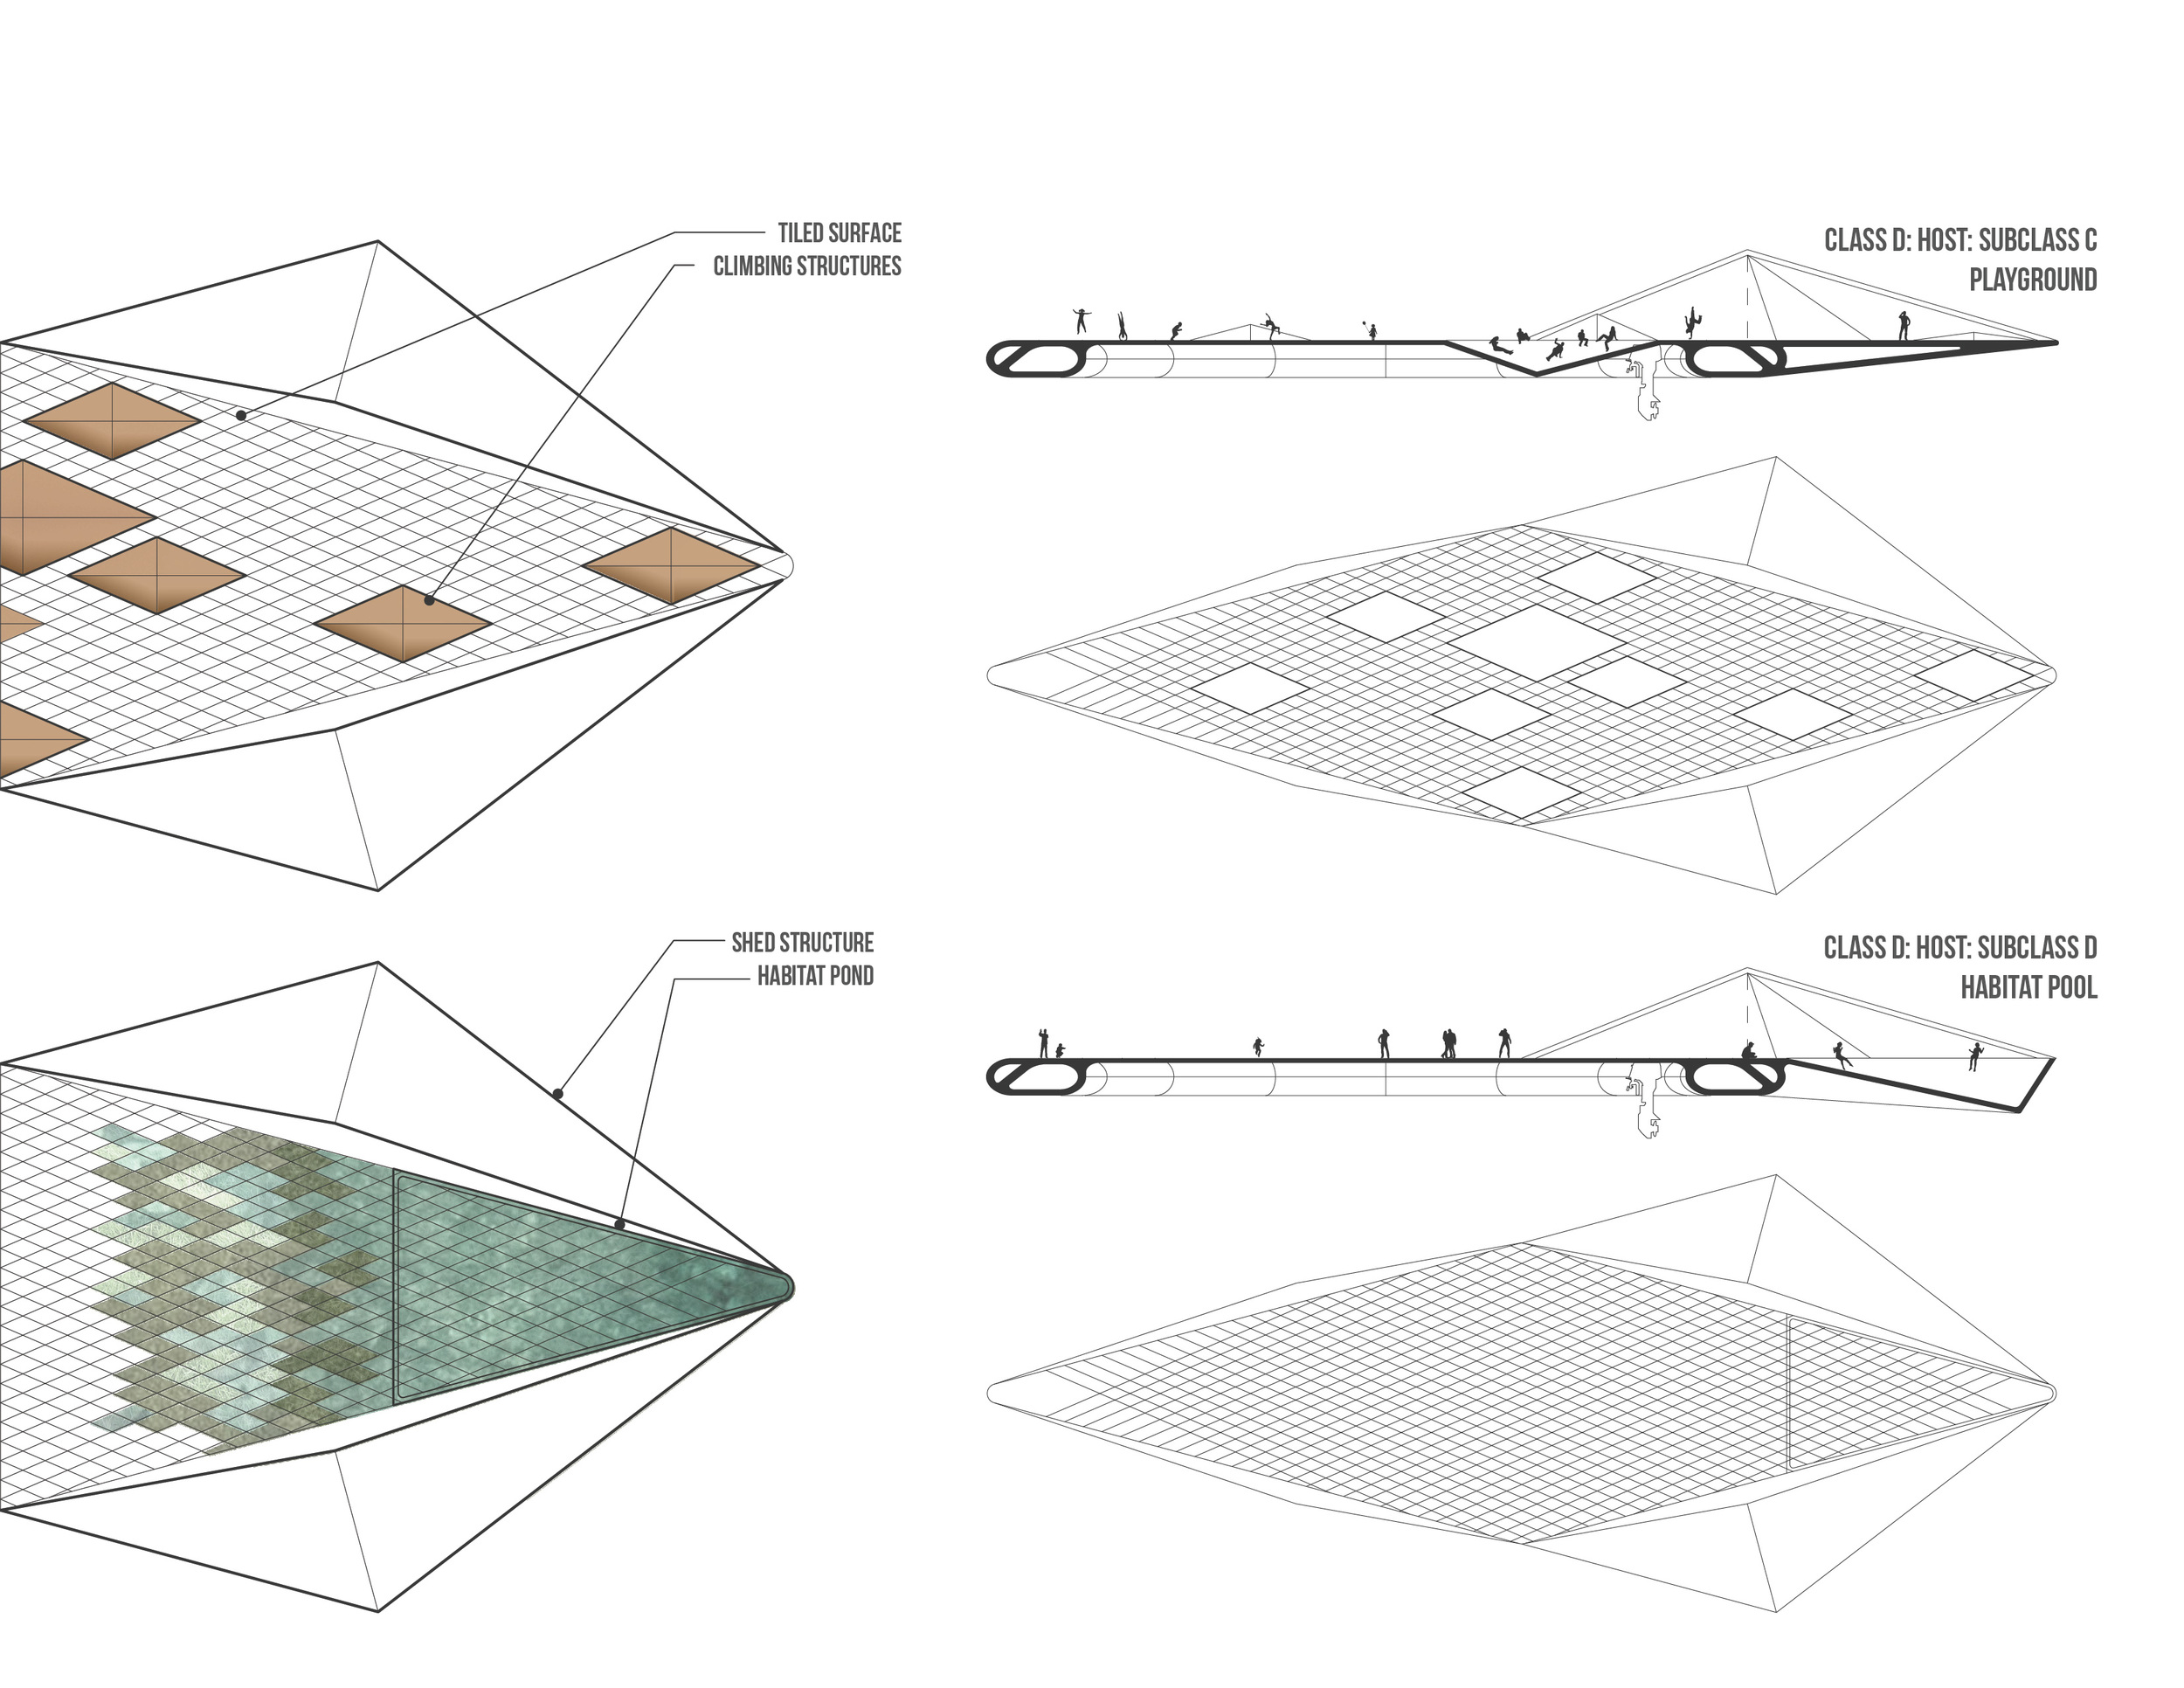
Mothership Component/ Recreation Space
Several mothership subclass typologies are illustrated here to suggest the programmatic potential of these aquatic vessels.

Component Deployment as Weather Data Registration and Pollution Filtration
The CSO intervention was designed to rendering invisible processes that occur which lead to the direct damaging impacts on our waterways. The component system is designed to operate outside of the transportation right-of-way. In this zone between the shore and the right-of-way the components are deployed from the mothership in clusters. The clusters then separate and move closer to the CSO, and in-turn the shore, based on live weather data. The higher the chance of rain, the closer the components move towards the outfall. The Class A components begin to accumulate in a chain under the outfall when the chance of precipitation is greater the fifty percent. The components will rotate under the outfall as they become inundated with polluted waters and remain there until the precipitation event ends.

Philadelphia CSO Psychometric Chart/ Component development Biorhythm
Over the course of a year Philadelphia averages over 40 inches of rain and typically experiences several outfall events each month. Significant rains and their resulting outfall events are illustrated in the graphic here. The quantity of components needed for the intervention was derived, in part, from the City’s weather metrics that I compiled from local weather stations. I used this data to determine the typical frequency of CSO discharge events and measured it against how long it would take the volume of organic matter within the Component bladder to reduce the contaminated particulates and pass through the filters and be ready to accept additional discharge. A single component was designed to be large enough to accept an average discharge volume. This single component would take 26 days to recycle and be ready to be deployed again.

Outfall Event/ Component Deployment
This rendering illustrates the deployment of the components from the mothership across the river to the outfalls.

Digital Ecologies: Saturation
The movement and accumulation of sedimentation particles is a difficult process to capture. This exploration attempted to simulate the process in an animation to give form to the seemingly invisible bathymetric development.

Plume
To illustrate the sedimentation accumulation within central Biscayne Bay a point cloud of sedimentation accumulation levels were juxtaposed over the bay’s bathymetry and processed through a script that rendered the density of the deposition. This script also illustrates potential shifts in the submerged terrain based on the location of adjacent points of high sedimentation accumulation. Showing the potential links here traces the potential futures of the bathymetric development.

Analogue Feedback
The results of digital study were transformed into a physical model. In the model each nut represents a storm sewer outfall location. The wire represents the flow of sedimentation from the outfall to high points of accumulation within the bay.

Animation
After developing the physical model the final sequence was rendered into a video that was displayed at a design festival in Philadelphia, PA.

Fibbonacci Tiling
The challenge of this investigation was to create a physical surface that is unachievable by conventional drawing and construction methods. A continuous angulating surface was divided into 28 16”x16” segments, forming a grid of contiguous tiles. Each tile was explored individually with one rule; the surface of each tile must meet its original edge boundaries.

Tile Geometry
Tile C3 was organized around a circle. This circle was extruded into an inverted cone-shaped component. After the component was developed it was coupled with an organizing geometric structure. Parametric modeling was used to govern the component’s population around the geometric structure within the bounds of the ties extents. The golden section was spiraled to develop the geometric structure within the tile; after the component was populated along the spine of the geometry it was rotated 360° and extruded the extents on the tile. This resulted in a highly complex, planimetrically symmetrical, yet sectionally radical and continuous structure.

Milled Component
The tile was milled by carving several paths into the block with a 1/4” ball cut. After the rough paths were completed a second round of passes were made with 45 degree 1/32” bit. Finally a step-over pass was made to smooth the tiles surface.

Milled Component
6-axis CNC machining

Gallery Exhbit

Paper Geometries
To create the digital structure a component was designed and paneled around a sphere. After unrolling the three-dimensional model into flat digital surfaces. The surface were then cut and scored for folding. Tabs and slots were modeled and cut into the surfaces to link the folded components.

Digital Model
Completed digital model

Ora Obscura: Dreams of a HyperReality
This project is a provocation about the potential of future landscapes. How can we maintain access to our digital communities without slowing down engagements with the physical realm? This film explores one of the potential solutions where engaging the natural and artificial realities is an intertwined experience.

Hybrid Realities
This still frames illustrates a customized user interface within this hyperreality.
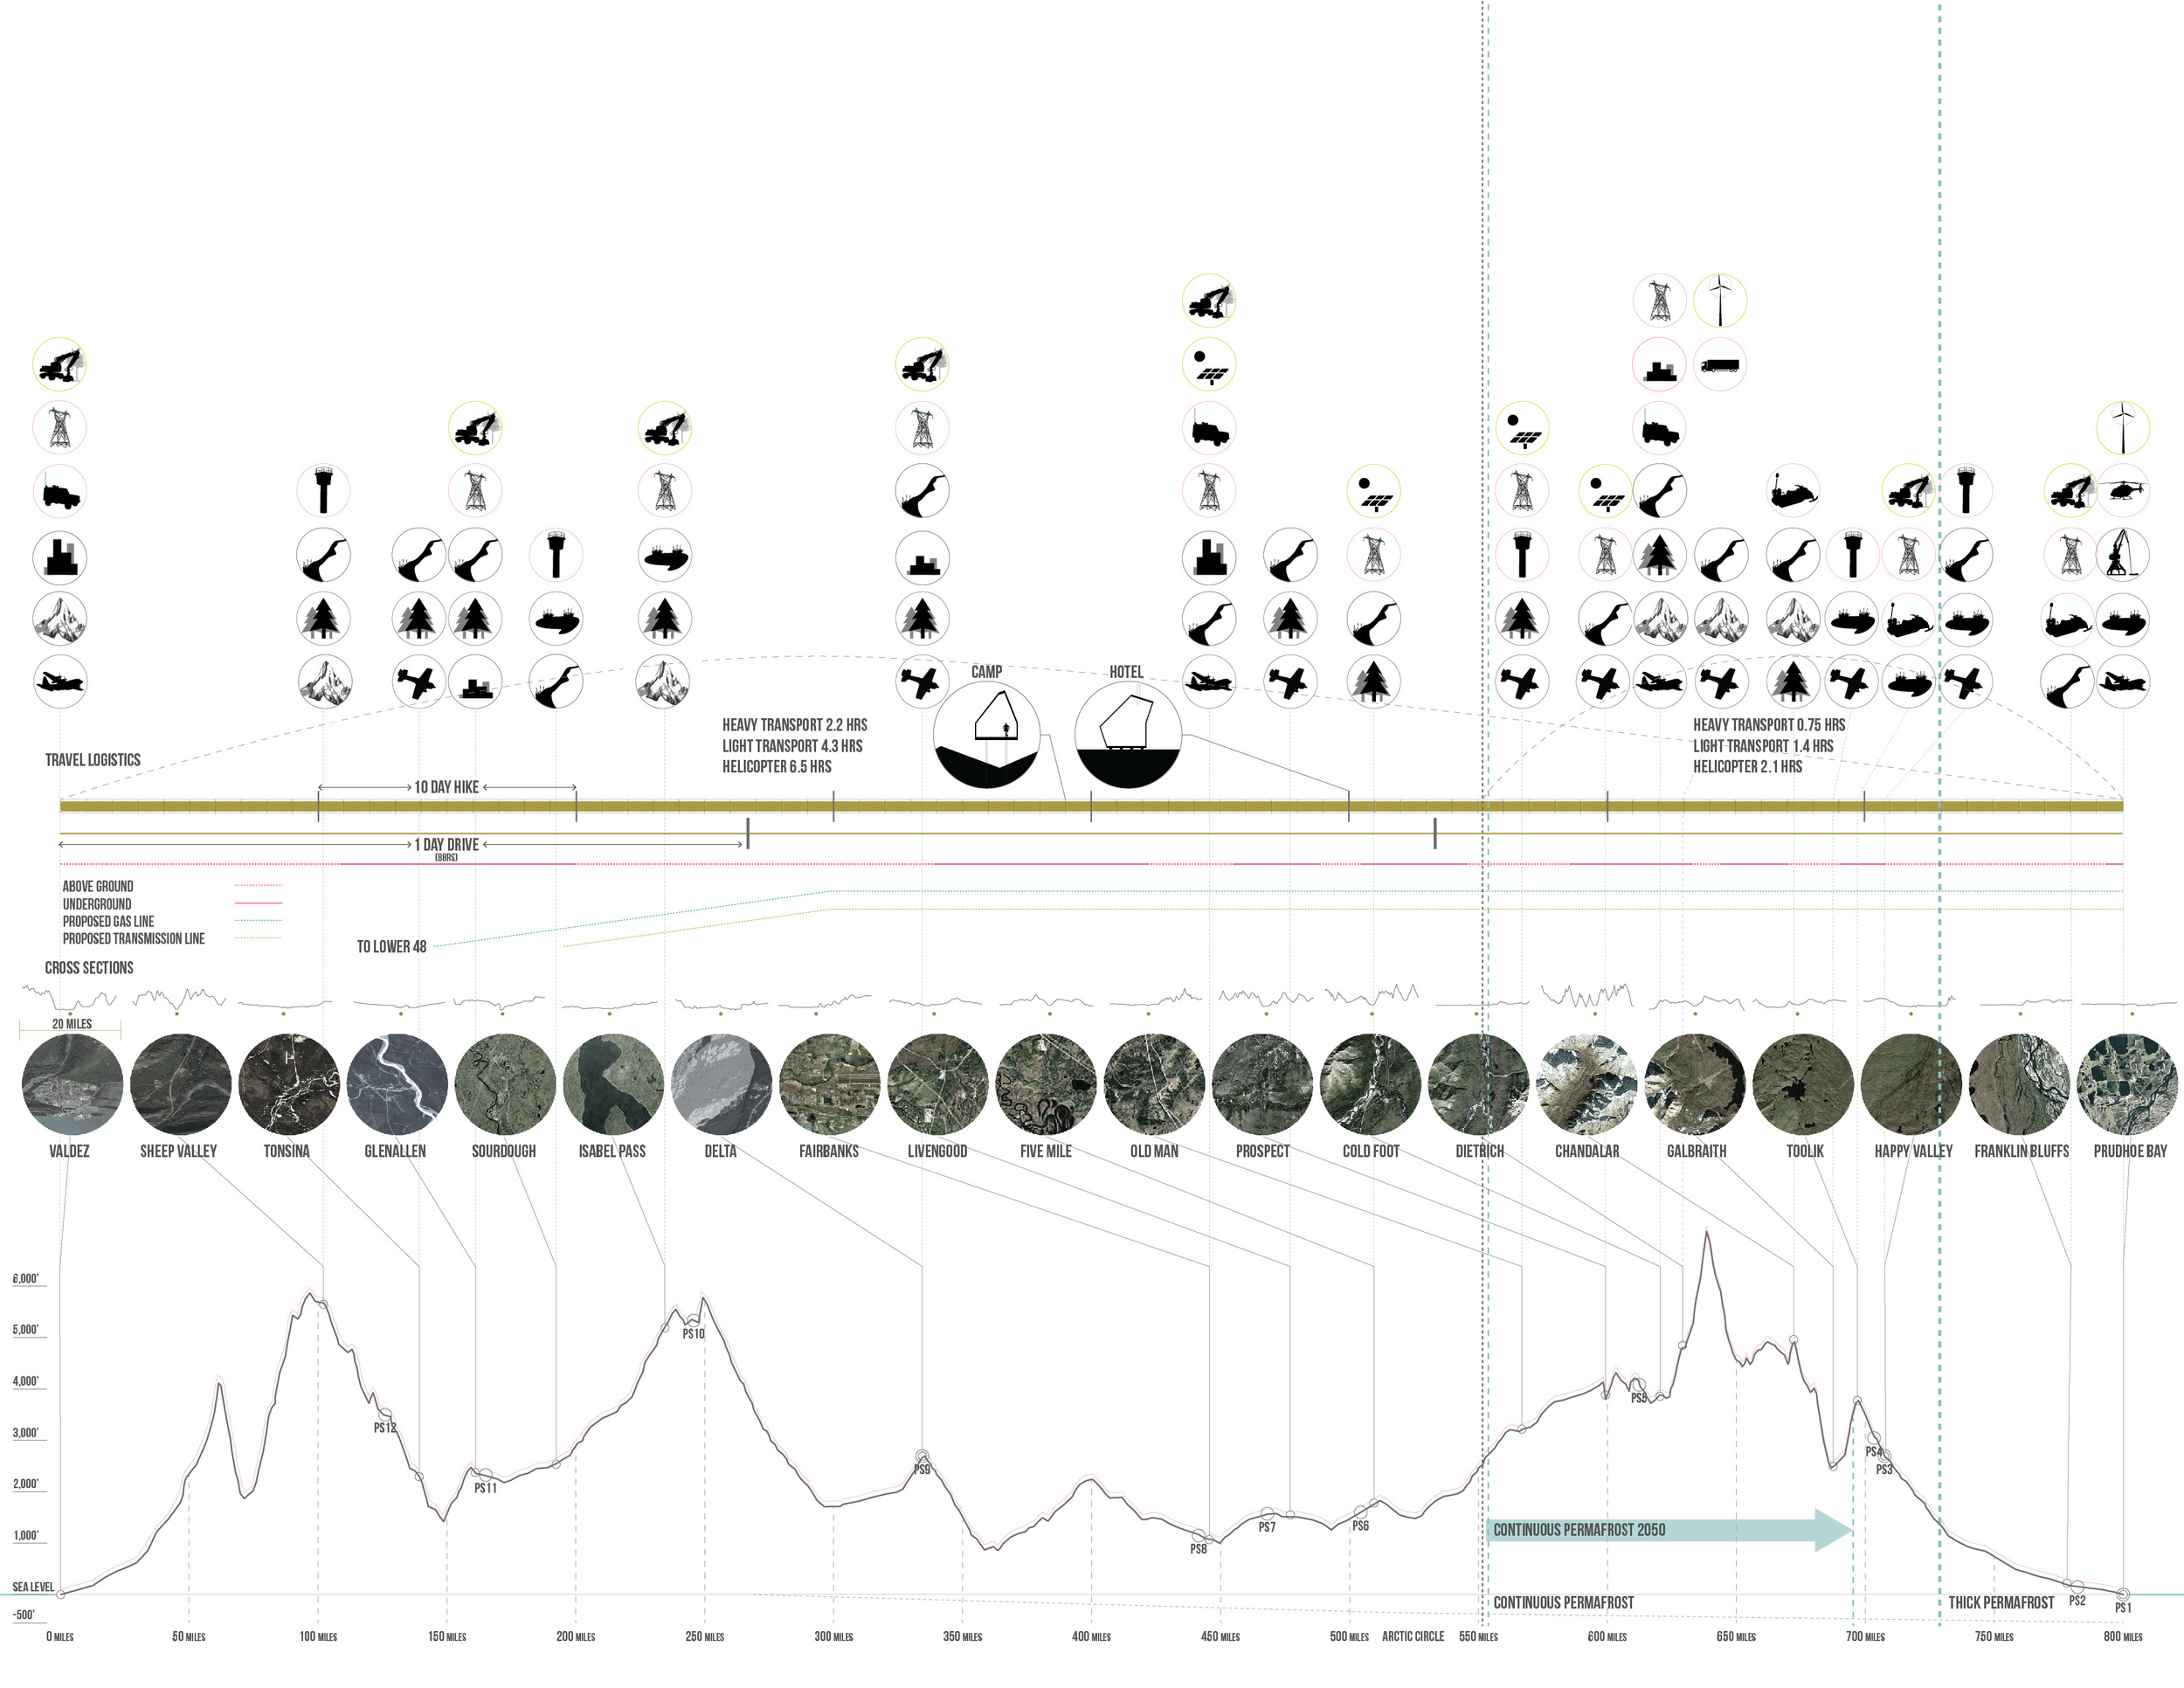
CRUDE FRONTIERS
No territory in the United States exhibits a bigger tension between extraction and conservation on public lands than the North Slope of Alaska; Crude North investigates future scenarios of extraction on this territory. To understand what might happen next here, we can look to what has happened in the past: the population in Alaska has grown and shrunk in response to oil plays, in consistent boom-bust cycles. How might an expanded eco-tourism economy help to buffer the swings of the extraction economy, and how might hybridized installations along the Trans-Alaska highway and pipeline support both workers and tourists?
Today, settlements cluster around pipeline pumping stations and depots dating to the pipeline’s construction. Much of the route will need work as a result of shifting permafrost zones. This project imagines a Trans-Alaskan energy armature that in the near future might be expanded and rethought, offering new facilities for the extraction rush and the experience of nature.
AQUEOUS INFRASTRUCTURES
Much of Florida is an environment whose image has been recast, and its ground transformed, from “uninhabitable” swamp into a tourist/retirement mecca. The entire Sunshine State is a region of attractions, theme parks and water-based recreation. A principal motivation of the studio, which will focus in and around Miami, is to provoke challenges to conventional approaches to waterfront design. It is a region that is one of the most vulnerable to climate change yet, despite the conflicting agendas of various interests groups over resource allocation for restoration, conservation, and development, they all tend to operate with similar presumptions about the stability or predictability of their particular model (whether habitat, markets, etc). As an alternative, students will be asked to develop projects that identify multiple scenarios/conditions under which their projects can perform based on environmental or economic fluctuations. Given the context of Miami, a primary question for the studio is: how can we take seriously the notion of “attraction” without confining the landscape to a nature reserve model or a theme park model, both of which are bounded in time and space? And secondly, as a means to think about how we employ technology in the making and control of landscapes, how can the notion of “liminal machines” facilitate this exploration (liminal being a state of transition or in-between; “machine” being an apparatus that performs some explicit function)?
-Karen M’Closkey
This project addresses these questions by focusing on Biscayne Bay in southern Florida, an estuary that connected the Everglades to the Atlantic Ocean until rapid development in the early to mid-twentieth century radically altered the relationship of this freshwater/saltwater exchange. The city of Miami sits on a limestone ridge at the threshold of these zones. The projects extents include the northern area of Biscayne Bay; however, proposals will focus off of the shore of the developing Brickell district. The site, which is an extension of downtown Miami near Miami Beach, offers the ideal location and conditions for considering the relationship between touristic and ecological understandings of place.
INTERSTITIAL LANDSCAPES
Olympics and the Seville Expo in 1992, through to the global economic collapse of 2008, Spain experienced an unprecedented expansion of its urbanized territory. Between 2002 and 2008 alone, more than 4.4 million new residences were constructed across the country with current estimates of more than half of these continuing to remain unoccupied (McGovern 2008; Campbell 2011). Spain built more than 5,000km of new highway in the last two decades, leaving the country with the fourth longest highway system in the world behind only the continental networks of the U.S., China and Canada (Eurostat 2011; CIA World Factbook 2012). Of Spain’s 50 international airports, 15 of them qualify economically as ghost airports based on annual passenger numbers, with the privately financed Aeropuerto de Ciudad Real perhaps the most conspicuous with zero commercial flights currently scheduled despite an investment of 1.1 billion Euros (Grupo AENA 2011; Moran 2012). Spain has constructed more than 2,600km of high-speed rail track, ranking behind only China in terms of total length, with plans to have doubled this length by 2015 (Sheehan 2012; EuropaPress 2010). And Comunidad de Madrid alone built 65km of new metro between 1990 and 1999 and another 118km of new metro between 2000 and 2011, creating the eighth longest metro system in the world despite being only the 50th most populous metropolitan area (MetroMadrid 2012). This infrastructural investment was companioned by the construction of innumerable cultural and civic facilities throughout the country, including infamous white elephants like Peter Eisenman’s Galicia City of Culture and Santiago Calatrava’s City of Arts and Sciences in Valencia.
-Cristopher Marcinkoski
Despite the current media narrative regarding the exceptionality of the global real estate bubble of the first decade of the 21st century, these abridged urban landscapes are not a new phenomenon. Rather, episodes of failed speculative urbanization are a recurrent circumstance throughout history, taking place at a range of scales with varying degrees of long-term effect. Contemporary and antecedent examples abound, but the recent proliferation of these unfinished territories demonstrates an increasing reliance on urbanization as a preferred instrument of economic production in both established and emerging economies. While there is little question that these dormant settlements are a consequence of economic and political policy decisions made primarily outside of the traditional purview of design and planning, the premise of this investigation contends that the physical planning and design solutions that have companioned this speculative urbanization are equally complicit in the production of these failed landscapes.
This project used the current urbanistic situation in Spain as a laboratory within which to consider the vast and numerous landscapes of incomplete and unoccupied contemporary urban development, leisure amenities and mobility infrastructures that have proliferated globally over the last two decades in a range of diverse geographic, political and economic contexts.
EDAPHIC ECOLOGIES
The City of Philadelphia’s leadership has pinpointed vacant land as a potential resource for augmenting its overburdened stormwater infrastructure. Inadequate stormwater infrastructure is one of the most prevalent problems facing post-industrial cities, like Philadelphia, today. Irrespective of whether stormwater and household-waste sewer systems are combined (CSS) or separate (SSS), the largest waterway pollution comes from wet-weather flow. The increasing relevance of “green infrastructure” today, which was merely a fringe concern two decades ago, is impressive and essential; however, the checklist of quantifiable criteria, lack of research or exploration, and segregation of the disciplines has led to a small number of default solutions for bio-technical stormwater features.
This project uses two separate but emerging trends in landscape, bio-synthetics and digital media, to explore customized ‘green infrastructure’ features in sites of vacancy. The site chosen for this investigation is an abandoned pier off the on the Delaware River just north of Penn’s Landing.
LIGHTXSOUNDXMOTION
LightxSoundxMotion (LSM) is experimentation in developing thickly operable and highly flexible spatial constructs that rely upon direct, qualitative and/or quantitative feedback with physical constructs.
DEPLOYABLE ECOLOGIES
Combined sewer systems have were, historically, a convenient solution for developing American cities. Our secondary and tertiary waterways were once considered undesirable bodies or water that produce disease and were primarily used for industrial transportation. In the recent decades we have appropriated our view on these resources and value these aquatic resources for the ecosystems that they support and their recreational potential.
Today these hydro infrastructures are a large burden on our fresh waterways systems. During rain events combined storm systems are inundated by the volume of rainwater and sewage that occupy the underground pipelines. When these events occur the combined water spill over the check dams within the sewer system and discharges out of combined sewer outfalls (CSO) into adjacent bodies of water.
In Philadelphia 164 active CSO’s discharge into the Deleware the the Schuchkill River’s. These discharges occur when as little as .2 inches of rainfall within one hour. In 2002 the City was fined millions of dollars for its poor water treatment practices and agreed to improve its water treatment system by 2020. Until the City updates its sewer infrastructure how can it deal with the frequent pollution discharges into its primary waterways?
This project is a strategy that provides a solution for mitigating the pollutions from the CSO’s while making the cause, effect and process visible at the source. Live data was taken from the Philadelphia Water Department’s public database and advanced computation techniques were used to model the outfall discharges and mitigation process.
DIGITAL ECOLOGIES
A series of sequential images were produced to illustrate the sedimentation accumulation process in shallow waters flowing from the mouth of Miami River south along the coast of Brickell.
FIBBONACCI TILING
This project was an inquiry into transforming complex geometry components into complex surfaces. Advanced computation techniques were used to explore the possibilities of using CAD to design, measure and construct, what was previously thought to be, unachievable geometries.
PAPER GEOMETRIES
Advanced Computation techniques were used to design and build parametric structures from sheets paper.
ORA OBSCURA
This film explores the potential of establishing the digital community within the bounds of geophysical place. In a future where open space is limited, Ora Obscura serves as a tool to create place and connect us to nature while also engaging with synthetic space simultaneously.